
You can ignore #Bitcoin, but you cannot ignore the consequences of ignoring Bitcoin.

This is the part where you do nothing and are greatly rewarded later.
It’s one of the most difficult skills: do nothing.
The more negative replies to this, the more likely it is true. Sentiment.
Sell the CAVE CHEESE 🧀🕳️ and buy Bitcoin!!! 😂
(point #5)

The Global M2 Money Supply chart reveals a striking trend:
The sheer scale and persistence of the M2 increase are impossible to overlook—and they seem to grow more significant every day.
With an 82% correlation to Bitcoin (BTC), even if M2 doesn’t perfectly predict BTC’s rise, the magnitude of this surge is so substantial that risk assets, including BTC, will inevitably be propelled upward by at least a portion of this momentum—if not all of it.
Put another way: the M2 climb is too massive and sustained to dismiss. It’s not just a minor blip on the chart—it’s a towering ascent. Risk assets have no choice but to ride this wave, whether partially or fully.
Buckle up.

This chart shows why the Global M2 Money Supply is so effective in predicting BTC’s future price direction
Here’s what the US government supposedly holds.
(Note: no $SOL, $XRP or $ADA, as Trump promised)
Source—https://intel.arkm.com/explorer/entity/usg


Directional Alignment with Global Liquidity
“Bitcoin moves in the direction of global liquidity 83% of the time in any given 12-month period, which is higher than any other major asset class, making it a strong barometer of liquidity conditions" @LynAldenContact (source of chart & quote)

Poor guy.
Exhaustion before the pump.

Everyone is talking about the Global M2 Money Supply predictive correlation to the Bitcoin price!
Here's a clip from @TheCryptoZombie
Thanks for the share!
If you want to watch my full video on this fascinating correlation of M2 vs BTC, see it below
Coingraph posted my chart without crediting me😒😒oh well🔥

👀
So, basically Trump’s WLFI currently holds 96% ETH or Ethereum-based assets.
Got it 👍

https://youtu.be/pO4xJ2jPbPo?si=TZv3j2yVZjtifu5L
New video regarding my last post
Rally: March 25 - May 14 (and counting)
The Global M2 Money Supply chart just printed another vertical line. (See far right side of the chart. Yellow line.)
The rally for stocks, bitcoin, crypto is going to be epic.
March 25th is the approximate date. 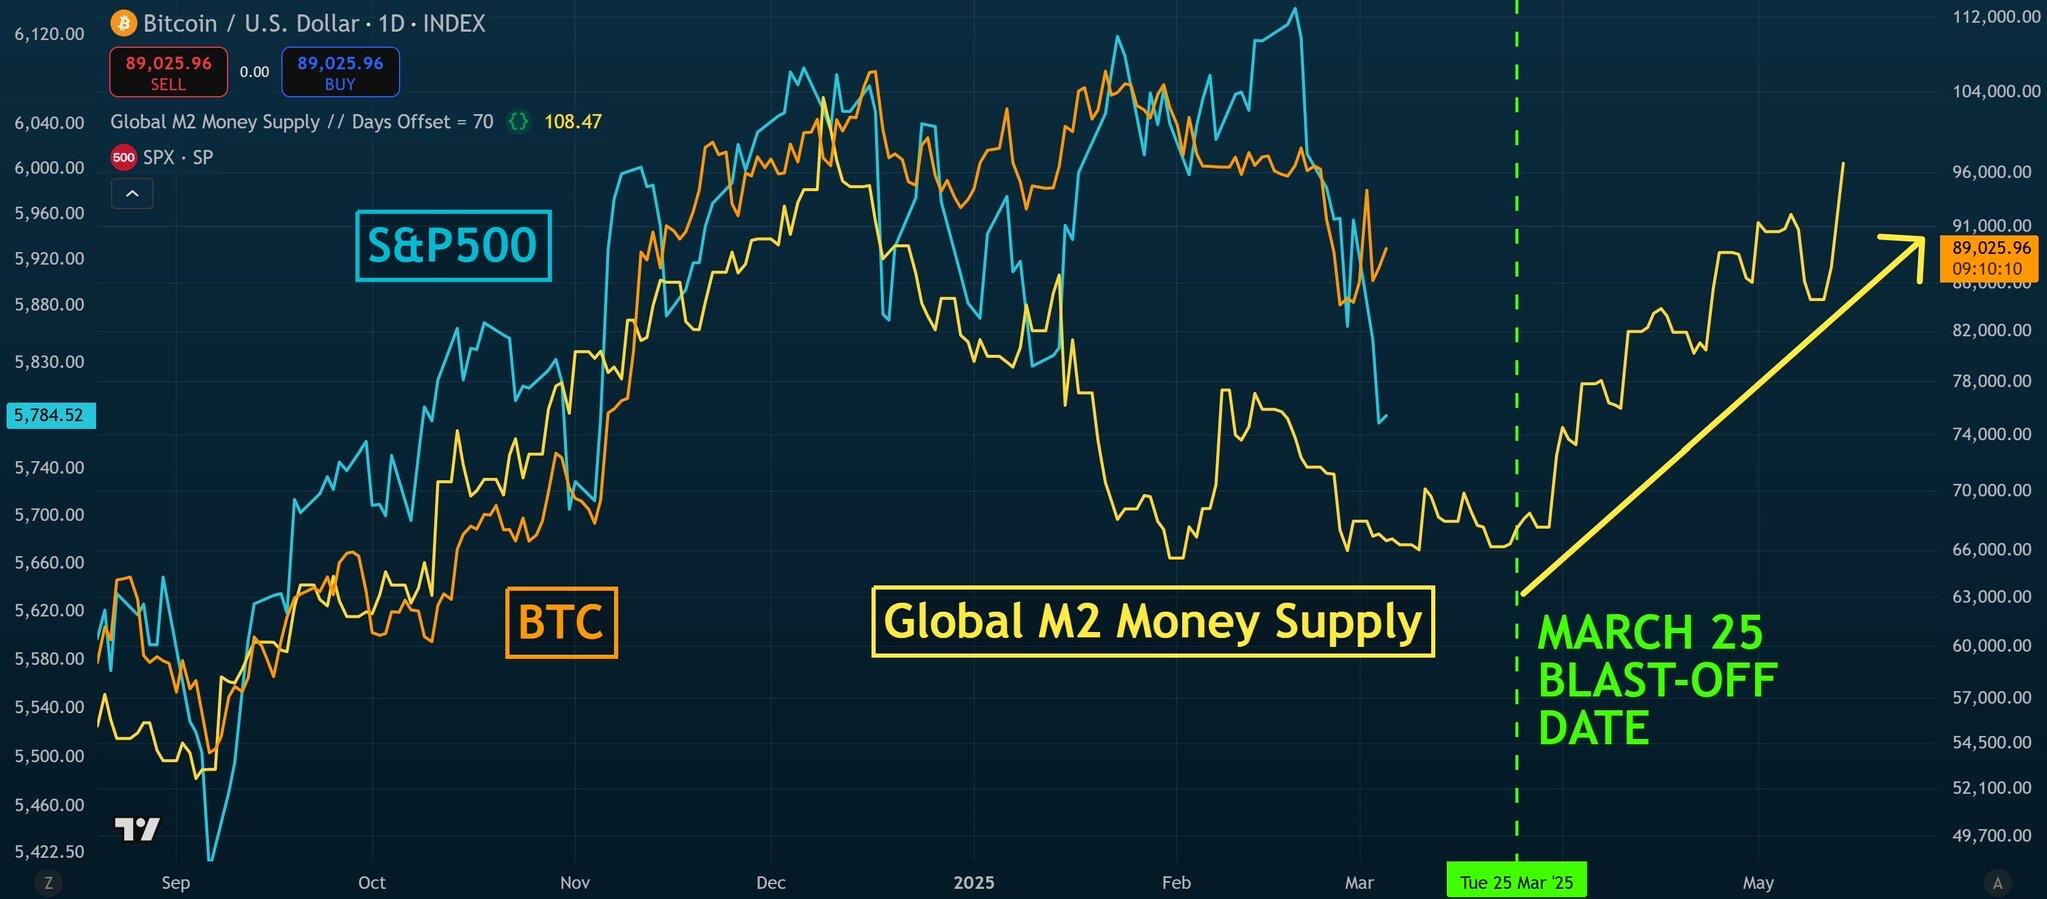
I think the top is not in.
Why? Many are calling $109k the top.
It's GOOD that many are saying the top is in. If many people weren't doing this, then it couldn't go higher.
Only when everyone is calling for "higher" will it be the actual top.
It's market reverse psychology.
Bitcoin cheat sheet


In one chart:
Global M2 Money Supply predicts BTC Price and S&P 500 move up, approximately March 25.
This is not a guarantee. It's an observation. Let's watch together and see what happens.
Watch my recent video for more on this correlation: x.com/ColinTCrypto/s…