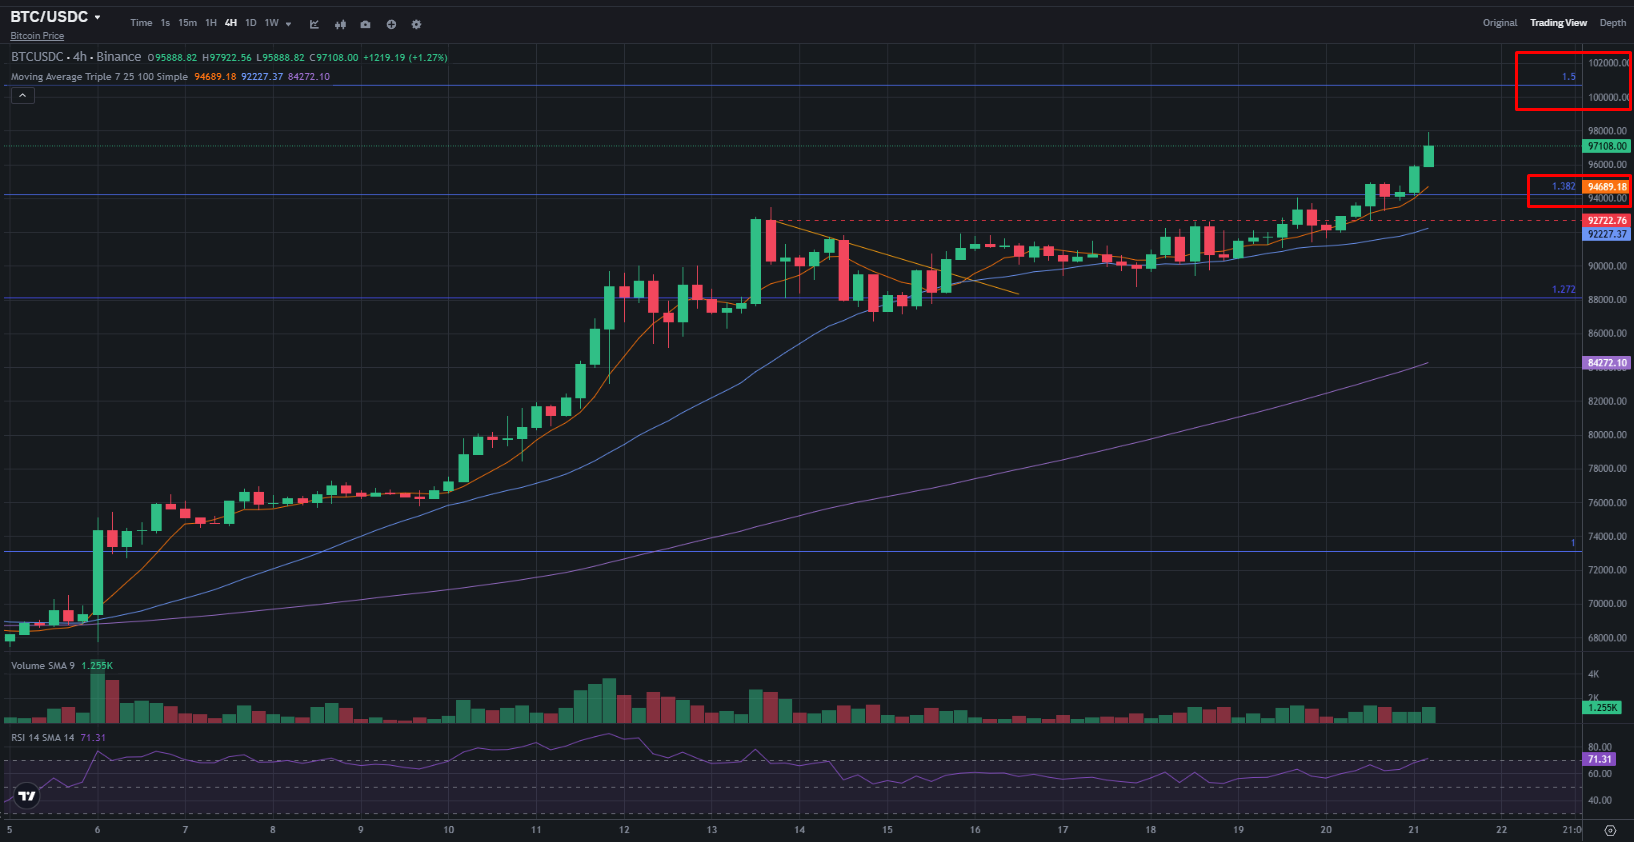

Thats interesting, I have the 1.382 up near 110k
BASIC co-creator Thomas Kurtz hits END at 96 - Pioneering Dartmouth College mathematician died last week Obit Professor Thomas Eugene K... - https://go.theregister.com/feed/www.theregister.com/2024/11/20/rip_thomas_kurtz/
May he rest in Peace - First coding I ever did was with BASIC
Chart shows all the RATE decisions by the FED since it began raising and the effect on Bitcoin PA and other Key moments
To me, It shows that the Effect on BTC was indirect and that it was when other comapnies collapsed, thats when BTC stalled a bit
BTC rises from Jan 2023 despite continued rises

Bitcoin back over 35 ounces of Gold per BTC
Couls we hit 50 ounces in Dec ? It is Very possible
The Current ATH is 37.322 ounces
There is certainly resistance till then and this all depends on so many factors
GOLD has Droped for 2 weeks, may fight back soon except BTC is a more favourable option now

Bitcoin still on the rise
Vertical dashed line is 25 Dec
This years target Is that 1.382 Fib line maybe - will the 2 meet ?
MACD starting to turn
RSI already falling - Histogram falling
Could be hidden BEARISH Divergence inside the Bigger BULLISH Divergence
Watch DXY $ and BTC.D


Why have I been saying "Be Bullish Cautious"
The 1st image is of the Push to the March 2021 ATH and PA this time round has repeated this with remarkable accuracy but over a longer time period, as can be seen in the 2nd Image of 2024
This leads me to think there is possibly one more Push before a large Sell off. That 100K target is Calling loud and strong, providing Market remains Bullish
The 3rd Image is the NUPL ( Bet Unrealised Profit Loss) and to keep it simple, Just look where the Real ATH's are in the past ( vertical lines ). Every one is in the channel we just entered. We can stay here for Weeks
So, if we follow the idea % Rise and Drop of PA and we look at the NUPL, we need to be Cautious that PA could be near an ATH that may turn over anytime
Longer Term, I see another push higher after this point but this may not be till Spring or later next year.
The Bull Run is not over this December but maybe not till December 2025


DXY $ since Jan 2023
We can see that DXY has been ranging since Bitcoin began it Rise to its current New High
So, Whats Next for DXY $ ?
You will notice how it broke out of range and has since dropped back in.
It did that once before in Oct 2023, after which it ranged for a month before falling back to the lower Trendline and it did not reach the upper line again until April 2024
I have included the MACD and RSI in this image as, to me, it all looks very Similar and that leads me to think that this could be repeated if the Macro situation remains the same.
BUT the USA has now got a New "Boss" and he is already shaking the tree.... and this maybe Good or Bad for the $
Last time Trump was president, the DXY Ranged really with a Range high low of 25%, falling initialy but recovering for the majority of his time in the White house.
Current range is 7% and, as mentioned, sitting at Range high
The Traditional Financial world waits to see where this will go next.
Large Wars do not make the DXY rise on the whole.
We all wait and as ever, Time will tell

problems posting here again
Often happens..any ideas why ?
Bitcoin Previous CUPS

There are a number of things to Note on the Bitcoin Weekly chart today
First and foremost is that PA has remained above the trendline that, once crossed, has, historically, led to PA reaching to the upper trendline and creating the Real ATH of the Cycle.
PA also closed Green on the Weekly candle, higher than ever before.
Selling has slowed despite the price rising, People are realising that to sell now may be STUPID
The MVRV Z score is Excellent. the Green Z Score has crossed over the MVRV line. This ONLY happens when PA is en-route to the real ATH
The Mayer Multiple has also crossed over its own MA.
We really could now be on the way folks.
The next 12 months will be emotional but what ever happens ->
DO NOT SELL YOUR BITCOINS


I have been trying to figure out where BTC is going next and I am STILL saying that CME Gap is a very possible target at some point in the near future.
Maybe Weeks but , as always, in a Bull Run, which I believe we have now entered, Gaps can be ignored
MACD & RSI OverBought
Histogram falling
PA may Range again for a long time but a Dip while doing so is a high probability


Been posting this for nearly 2 years around the place
The 2013 -> 2017 BTC ATH PA Fractal superimposed on Current PA.
It is a no brainer.
Only reason we fell below Fractal so much in 2022 was because of pressure from FED, causing the Collapse of LUNA and FTX and Others
We got back on track early 2023
And we have follwed it ever since.
Still so many doubters

Why I believe the REAL Bitcoin ATH will be this time next year
Lots of evidence points towards current PA following the 2013 - 2017 Fractal including Aug, Sep, Oct Montly Candle close colours for 2023 and 2024. identical to those of 2015 and 2016
Also as can be seen on chart, the day count between ATH's
The 1st ATH in March 2021 was NOT the real one and was a result of Sudden publicity and FOMO. The same may happen again this time round.
Look at the ATH dates, November or December
But one of the biggest reasons is a technical issue called "OverBought"
The recent push up and possibly the continued push WILL require PA to reset at some point and the push high from Jan 2023 to the ATH in March this year ( which is NOT the end of a bull run ATH ) required PA to reset for MONTHS, in fact, it took from March 2024 to Oct 2024 before MACD has reset enough to be able to make a new move. 8 Months
We are VERY likely to do the same
We also have the day count between Halving and ATH to take into account. and this works out too..
Final ATH in Autumn / Winter 2025
There is so much more involved in this too that I will not explain here.
You have seen my previous charts, you will know.
HOWEVER, Real world events are making a huge difference and with the arrival of new Ethics concerning Crypto worldwide, things may change.
But for now, I continue with the 2013 to 2017 ATH fractal....It works, it fits
Look at the chart
Look at the numbers

I Like this a LOT
nostr:note1nn9ww45l86q2rcsuvmprhf92vmmzv3mj82j88jgvmdzj98hp2xms40spjx
Last post for now
PAXG PA (orange) over the Bitcoin Price ( yellow) since March 2021
It is a no brainer.
When BTC goes down, PAXG goes UP on average
Forget selling out to USDT or another $ backed stable coin because as that looses Value, so do you
Watch PAXG & the $ and decide which is best

THIS is Bitcoin direct traded to GOLD
See how BTC has gone Near Parabolic against Gold
As a consequence, it is Vastly overbought now
A pullback is highly likely
Traditionally, people sell out to $ stable coins but if $ looses Value, you also loose.
GOLD is likely to RISE
Use PAXG or Gold

This could be Telling
PAXG Daily chart
Pax Gold (PAXG) is a gold-backed cryptocurrency
PA back on support and look what happens previously
Is this telling us that BTC is about to pull back ?
The 2 Vertical lines on the left are ther previous 2021 BTC ATH
What happens when BTC PA Falls ?
Be Ready

Bitcoin 4 hour
PA still in pennant & with Apex tomorrow morning, we can expect PA to move before that
PA ALWAYS moves before APEX
Question is Which direction
MACD & RSI over Neutral and falling
Still looking to that CME Gap as a potential Move
A move higher is also possible
Impossible to say which

Everyday, EVERYDAY, I ask myself the same question.
It is like an addiction that self harms.
And yet, I find myself unable to react and do what we ALL know is the ONLY Cure to this problem
Yet, I know, If I sell, I will watch it like a man possessed.
The Question ?
WHY THE F*** DO i STILL HOLD XRP
