
🤖 Tracking strings detected and removed!
🔗 Clean URL(s):
mbpd.https://twitter.com/hashtag/oott
https://twitter.com/staunovo/status/1973074556576321807
❌ Removed parts:
?src=hash&ref_src=twsrc%5Etfw
?ref_src=twsrc%5Etfw
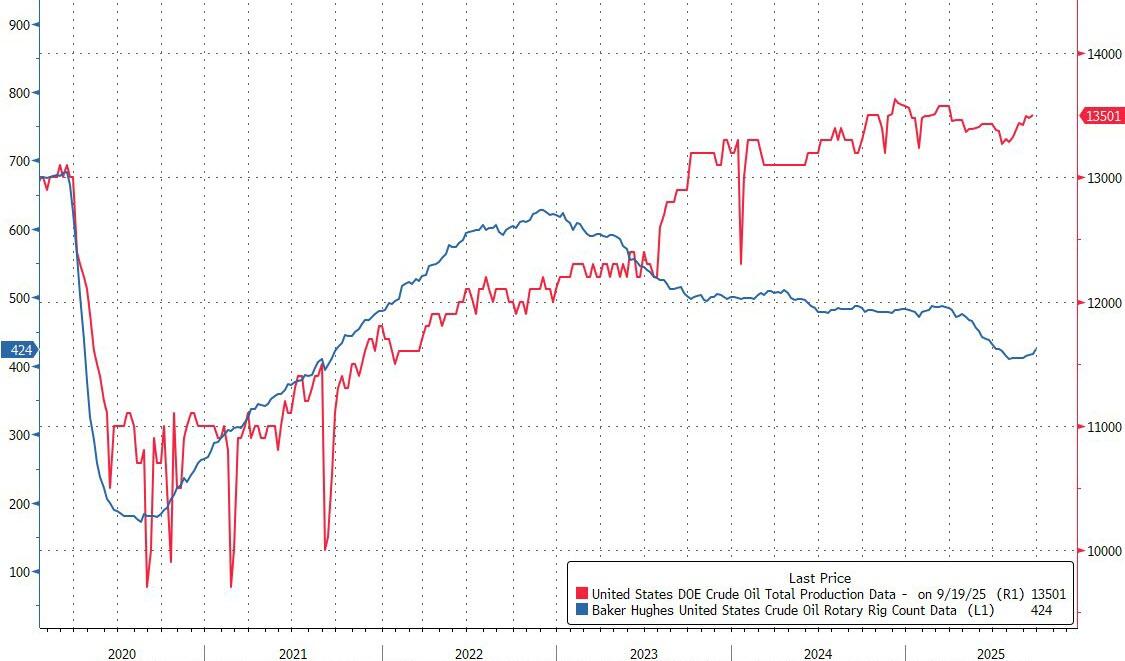
EIA Data Shows Record US Oil Output After Major Upward Revision
EIA Data Shows Record US Oil Output After Major Upward Revision
By Julianne Geiger of https://oilprice.com/Latest-Energy-News/World-News/EIA-Data-Shows-Record-US-Oil-Output-After-Major-Upward-Revision.html
The U.S. Energy Information Administration just delivered a statistical shock: July’s monthly data shows U.S. total liquids output hitting a record 21.218 million barrels per day, nearly 500,000 bpd higher than the agency’s weekly estimates had implied. Crude production came in at 13.642 million bpd, with natural gas liquids at 7.577 million bpd—both stronger than traders had been working with.
 ?itok=cwGr85LD
The upward revision wasn’t just on the supply side. EIA pegged total product supplied, its proxy for demand, at 20.984 mb/d, some 344,000 bpd higher than weekly data had suggested. Gasoline, diesel, and jet fuel consumption all moved higher, underscoring that U.S. demand hasn’t softened as much as some https://oilprice.com/Latest-Energy-News/World-News/Annual-US-Crude-Production-Sets-New-Record-in-2024-But-Growth-Pace-Slows-EIA.html
had assumed.
Oil demand weakness?
US oil demand was at 20.984mbpd in July, up 391kbpd or 1.9% y/y, record demand for the month of July, EIA STEO forecast had demand at 20.442mbpd.https://twitter.com/hashtag/oott?src=hash&ref_src=twsrc%5Etfw
— Giovanni Staunovo🛢 (@staunovo) https://twitter.com/staunovo/status/1973074556576321807?ref_src=twsrc%5Etfw
For perspective, EIA’s weekly series for July had implied closer to 20.7 million bpd of total liquids production and around 20.64 million bpd of demand. Those preliminary estimates now look understated compared to the more comprehensive monthly survey data.
The revisions matter because the market leans heavily on the weekly numbers for near-term trading signals, even though they are based on modeling and estimates rather than hard surveys. When the monthly data later shows reality running hotter, it can force a rethink on supply-demand balances.
The new figures will only add to the debate over how much slack the U.S. oil machine still has. Shale output had been assumed to be flattening, but the latest record indicates there could be far more resilience than expected. On the demand side, the stronger consumption data helps explain why inventories haven’t built as quickly as some forecasts suggest.
With the EIA revising up both sides of the ledger—production and demand—it leaves the U.S. oil market looking tighter than weekly data suggested. Traders will now be recalibrating their models accordingly. For OPEC, the message is clear: the U.S. isn’t done surprising the market.
https://cms.zerohedge.com/users/tyler-durden
Tue, 09/30/2025 - 20:55
🤖 Tracking strings detected and removed!
🔗 Clean URL(s):
mbpd.https://twitter.com/hashtag/oott
https://twitter.com/staunovo/status/1973074556576321807
❌ Removed parts:
?src=hash&ref_src=twsrc%5Etfw
?ref_src=twsrc%5Etfw
No replies yet.