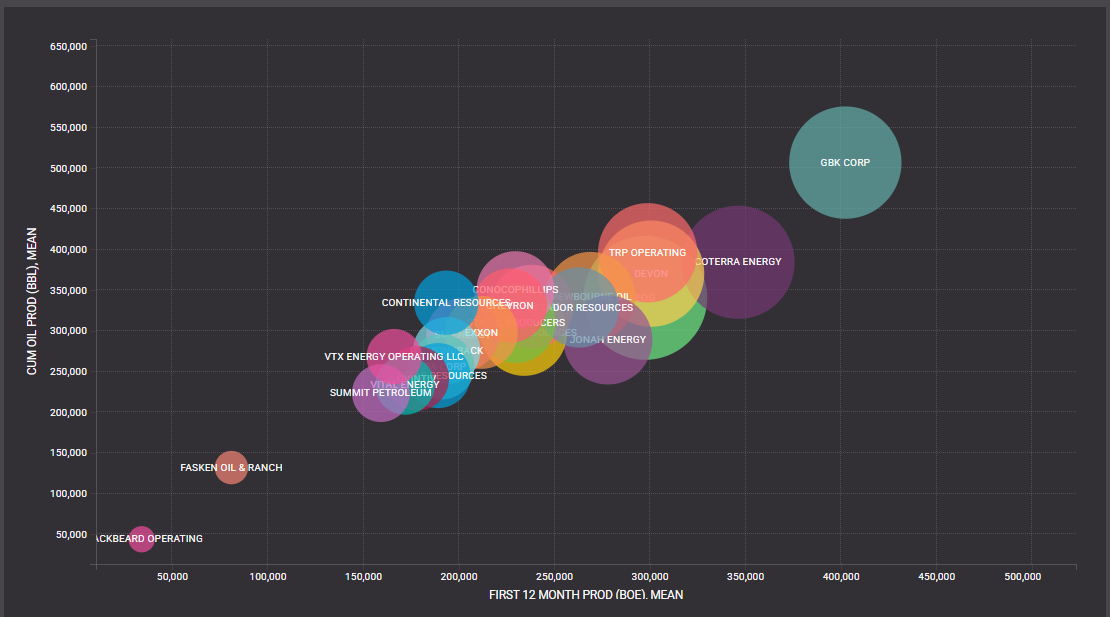
There you go. That gives an idea. Bubbles sized by first 3 months production. Y axis is cummulative production and x is first 12 months well average. Much of this can be explained by high or low quality acreage but when I zoom in, I find interesting disparities between operators. My guess is that anybody playing with equities should be looking at this as prices drop and consolidation wave starts to hit.