
These are great. Gonna go one on Ichimoku?
Golden Ratio Market Strategy
The Chart:
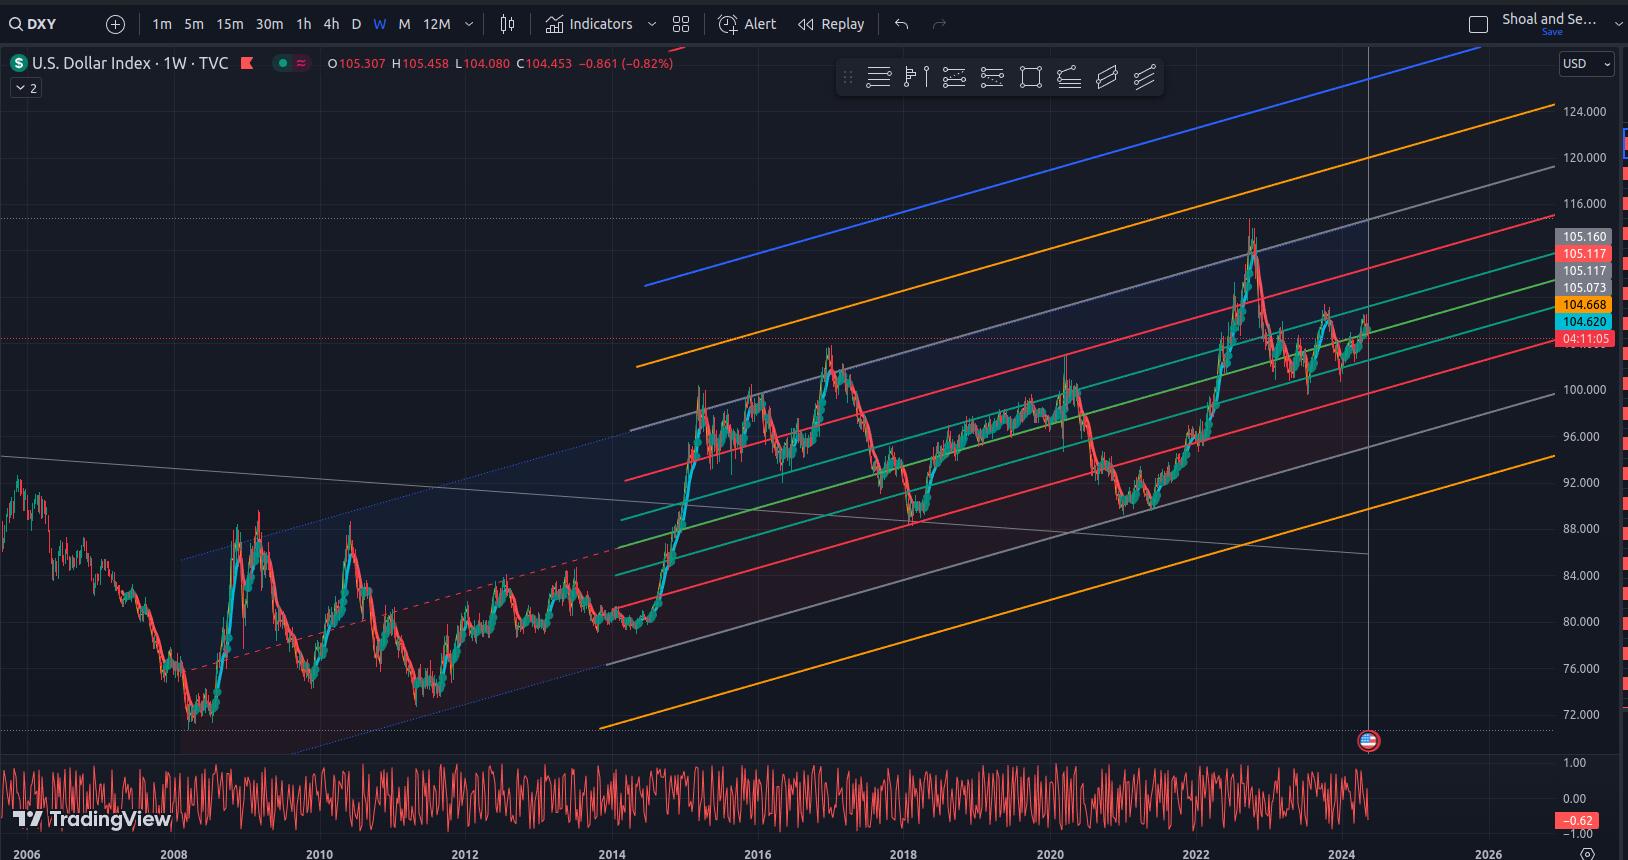
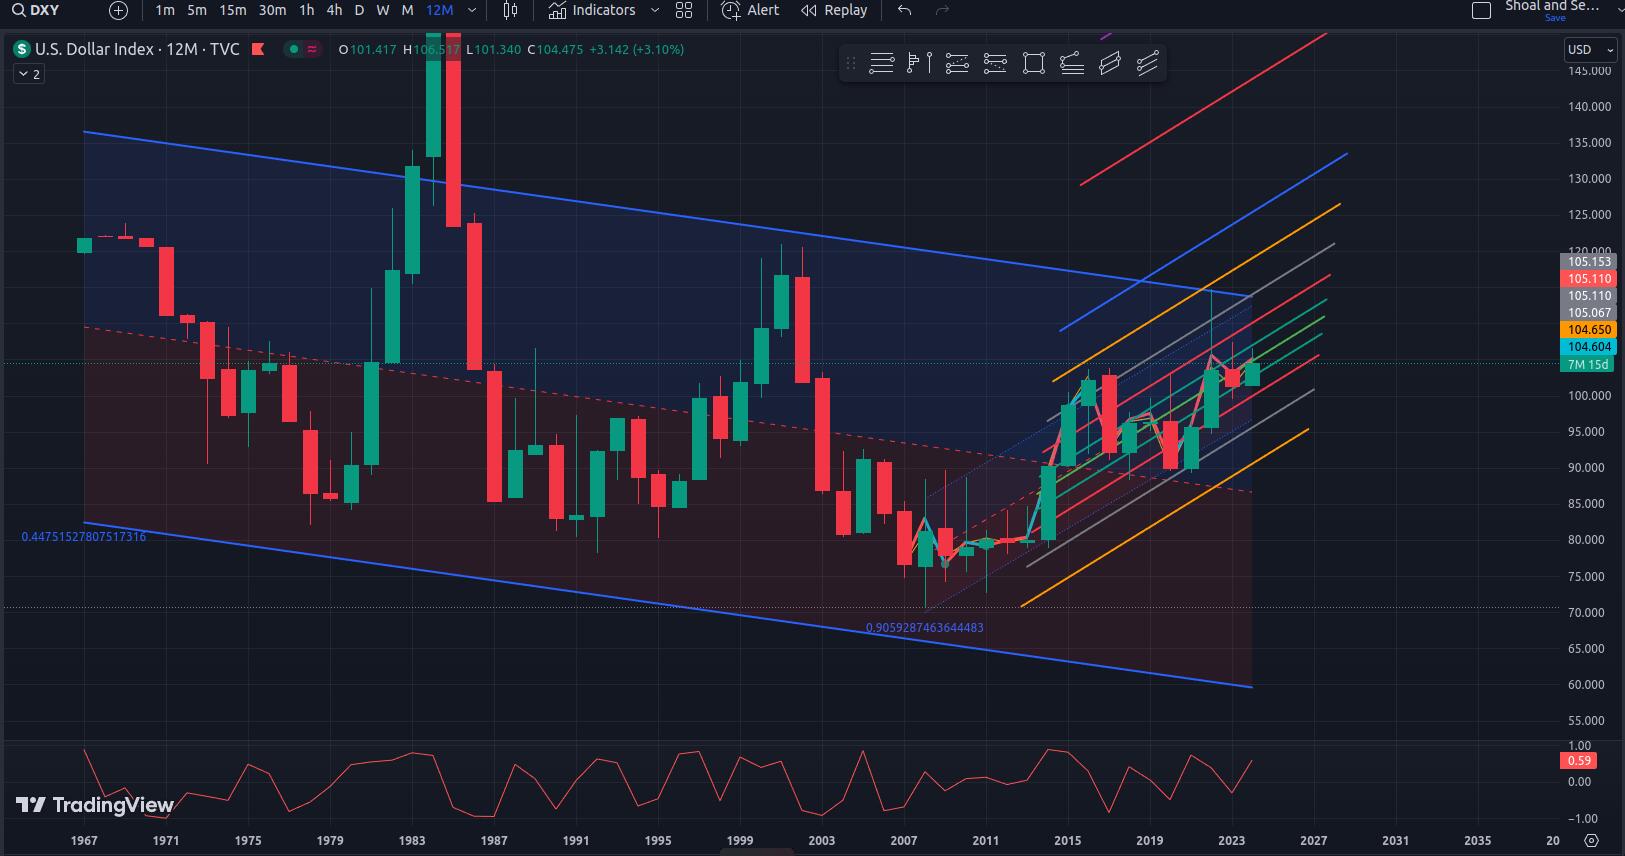
The chart presents a Fibonacci analysis technique, which is used to analyze trends and patterns within financial markets. By applying Fibonacci channels to the slope of a long-term trend, one can observe oscillations occurring within the channel as long as the channel remains valid. This helps demonstrate that the market is not entirely random but follows some predictable patterns. The Fibonacci levels provide potential support and resistance points, which can aid in decision-making for traders or investors. Be aware though that trends are embedded within trends. That is a conversation about Mandelbrot sets that is too deep for this discussion but the image below should illustrate the concept well enough for practical purposes.
• The chart presents a Fibonacci analysis technique (12).
• This technique is used to analyze trends and patterns within financial markets (345).
• By applying Fibonacci channels to the slope of a long-term trend, one can observe oscillations occurring within the channel as long as the channel remains valid (67).
• The Fibonacci levels provide potential support and resistance points (8910111213).
• This helps in decision-making for traders or investors (14).
Technique:

The technique involves identifying the Fibonacci channels within a long-term trend, with the goal of scaling buys near the bottom of the channel and sells near the top. This approach aims to maximize potential gains while minimizing losses by placing stop-loss orders safely below the channel.
As the channel ascends, traders should move their stop-loss orders up into profitable territory, effectively "locking in" profits along the way.
This analytical approach relies on the premise that financial markets follow recurring patterns, and using Fibonacci channels can help identify those patterns more easily. By scaling trades at key support and resistance levels within the channel, traders can potentially maximize their gains while minimizing losses. However, it is essential to remember that no trading strategy guarantees success, and even with this technique, there will always be some degree of risk involved.
• The technique involves identifying the Fibonacci channels within a long-term trend (15).
• he goal is to scale buys near the bottom of the channel and sells near the top (37).
• This approach aims to maximize potential gains while minimizing losses by placing stop-loss orders safely below the channel (67).
• As the channel ascends, traders should move their stop-loss orders up into profitable territory, effectively "locking in" profits along the way (612).
• This analytical approach relies on the premise that financial markets follow recurring patterns (457).
• Using Fibonacci channels can help identify those patterns more easily (8910111213).
• By scaling trades at key support and resistance levels within the channel, traders can potentially maximize their gains while minimizing losses (16).
Citations:
[1] https://www.forextime.com/education/forex-tutorials/retracement-in-forex-trading
[3] https://trendspider.com/learning-center/introduction-to-fibonacci-trading/
[4] https://en.wikipedia.org/wiki/Fibonacci_retracement
[5] https://www.tradingsim.com/blog/fibonacci-trading
[8] https://www.investopedia.com/articles/markets/010515/use-fibonacci-point-out-profitable-trades.asp
[10] https://www.warriortrading.com/fibonacci-retracement-definition/
[11] https://www.cmcmarkets.com/en/trading-guides/how-to-trade-with-fibonacci
[12] https://hmarkets.com/learn-to-trade/learning-hub/fibonacci/
[13] https://www.investopedia.com/ask/answers/05/fibonacciretracement.asp
[15] https://www.investopedia.com/terms/i/inverseheadandshoulders.asp
Discussion

I thought about it but it has a basic flaw that messes up my reads if i forget. It uses a rectangular time window. All time windows are parallelograms. Both dimensions are on the move. Its ok over shorter time periods but can make a big difference in weekly timeframe. I did the math to skew it by the sloope of enveloping trend once but meh. I hate doing math to trade. I usually dont even know th prices until after the read is done and am looking where I put the lines.
Also, I prefere scaled entries so that I dont have to be all that accurate. just accumulate in there and distribute up there for funds to accumulate when it comes back down here kinda thing.
More like fishing lol. fishing with math may be more accurate but way harder and you tend to miss forest for the trees. This should really be a 2 question read once trend line confirmed. 1. amplitude of oscillations 3. where are we in the oscillation cycle. after that its just capital management. This is really way easier than ppl think.
Cheers fren. glad you liked the article. will think about posting a modified Ichi one of these days if am feeling masochistic.
Word. I just keep buying and never sell. Ape into that shit...and outperform all my "wealth manager" friends.