
🫡
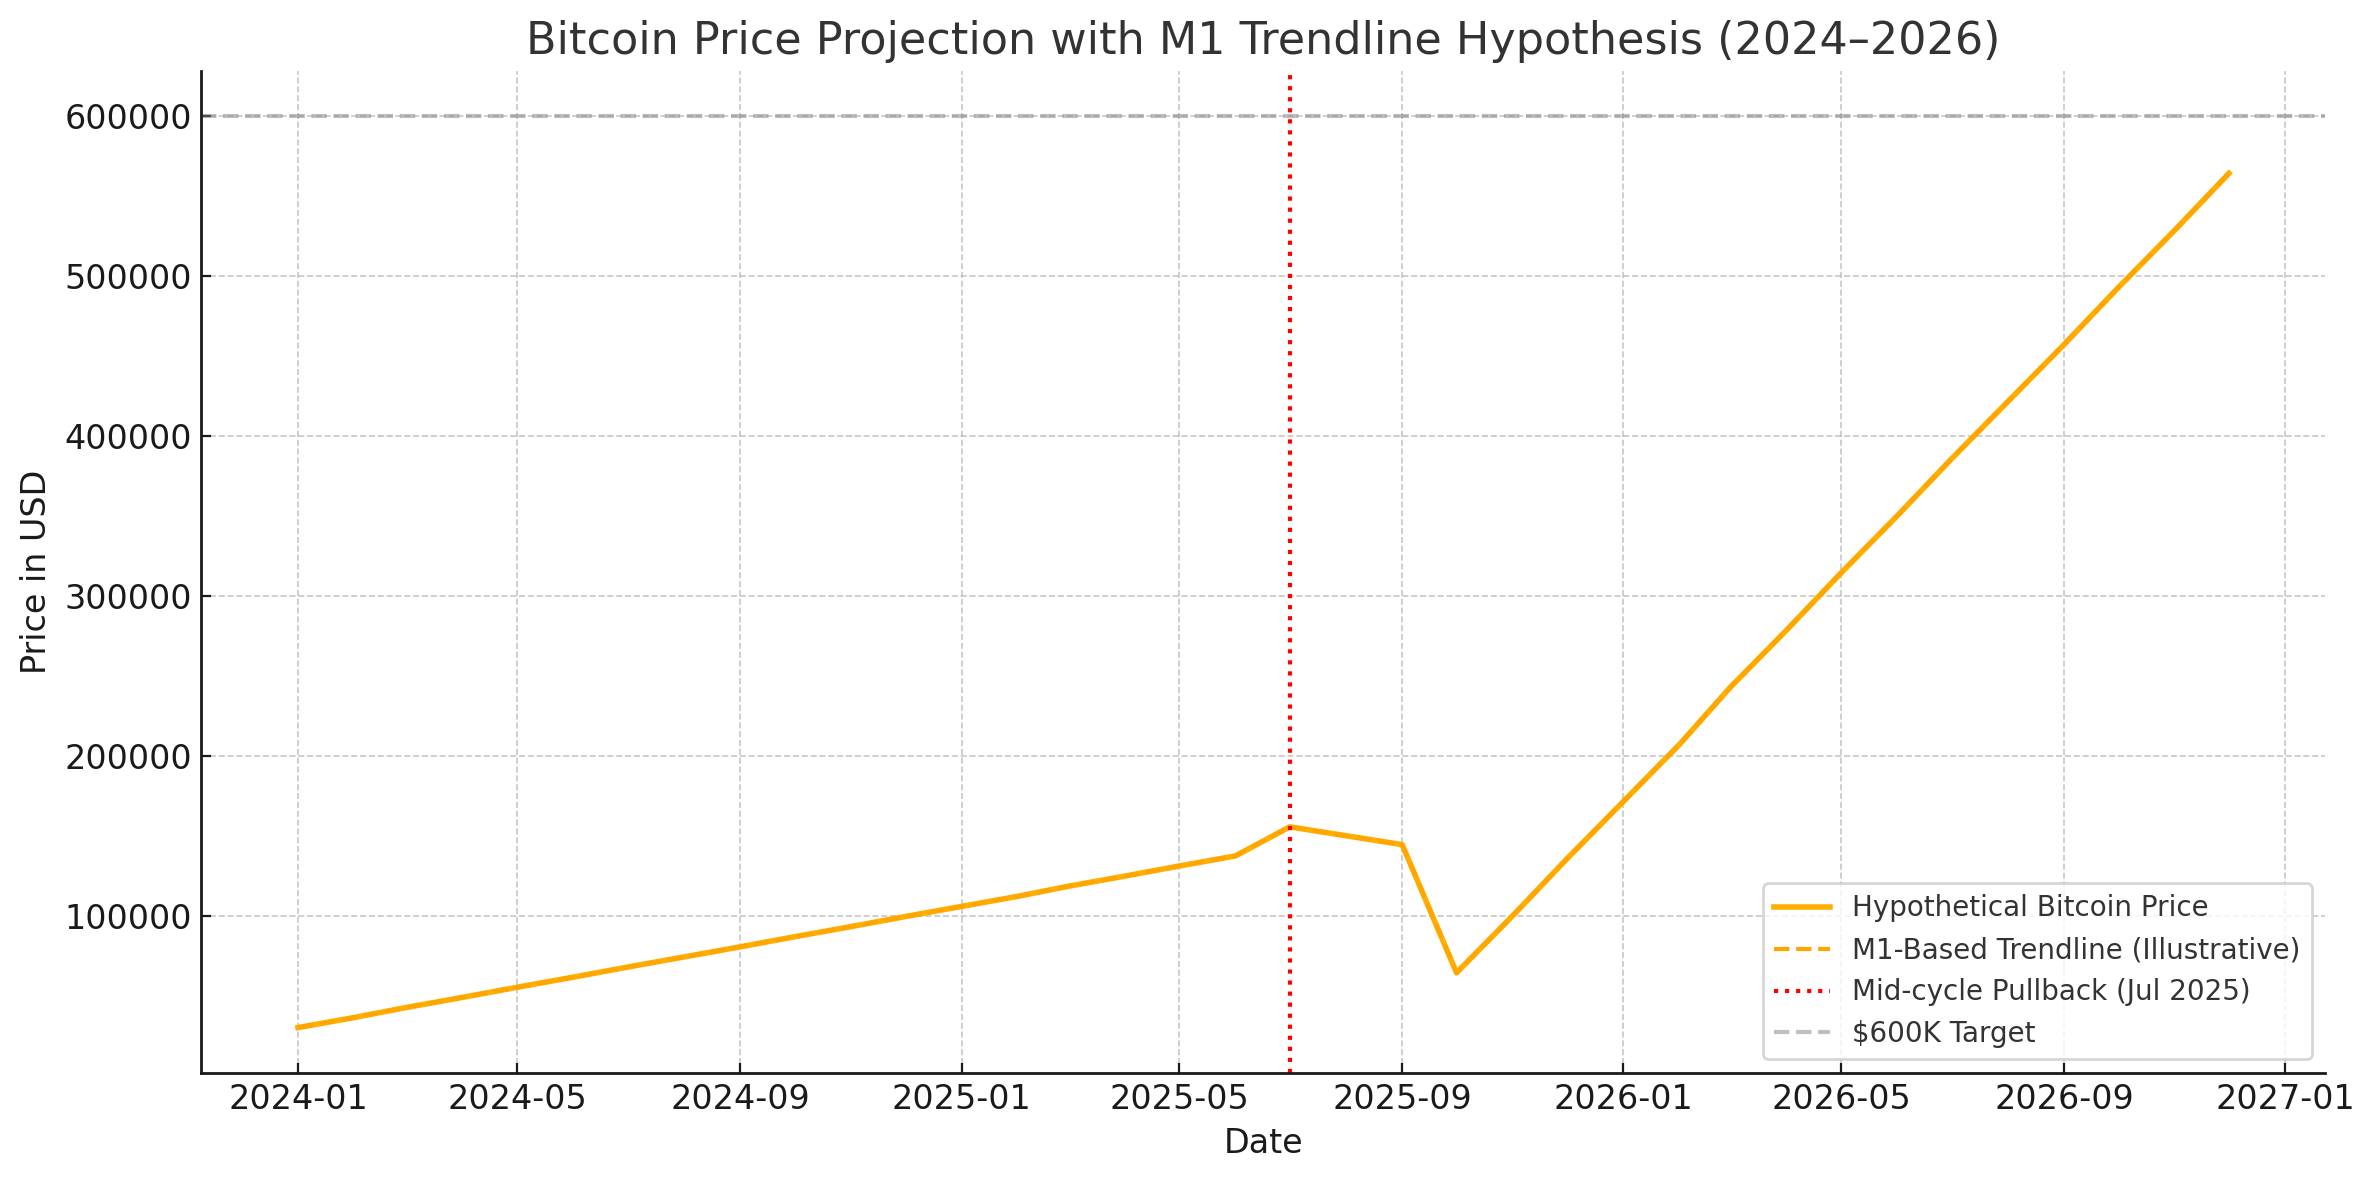
Here’s a much cleaner and more readable version of the Bitcoin projection chart:
• Blue Line: Projected Bitcoin price path (2024–2026)
• Orange Dashed Line: M1 money supply-inspired trendline
• Green Dotted Line: Theoretical global adoption S-curve
• Gray Horizontal Line: Marks the $600K speculative target
• Vertical Lines:
• Blue: Spot ETF launch (Jan 2024)
• Purple: Bitcoin halving (Apr 2024)
• Red: Anticipated mid-cycle pullback (Jul 2025)

nevent1qqs9tygfxhm286rq62750jafwcevvttcta59xl77vry2zx8w9zdlzfspz3mhxue69uhhyetvv9ujuerpd46hxtnfduue4caj
lnbc12220n1p5zavf0pp5qsjtqezj94c03a3mns4peccmr2jf4k5pgh4dw645frath5uejt3sdr4vf6h57nzda6r5gp4x5unzvpexv6kvdnpxdjnsd3svsexyep5xa3kycfexumrxvnrxcexgdecx4nrvwp4xvmkver9xccxxwrpxycnset9xgurjcnxxyervcqzzsxqzuysp57vz9e8v07c409khvs6ulzvsqsq3zxvd97harpjrv3gkprtnx8jss9qxpqysgqv859k3ganeehtuyjg2nlzsnl4xllk9vumpmphxr6e4j6wh83970j6xxcs4x3gwpztpexpxnq0a9umd45yzhgq8lu0gm0qlwr67zwslspa7s9uh
lnbc12220n1p5zavf0pp5qsjtqezj94c03a3mns4peccmr2jf4k5pgh4dw645frath5uejt3sdr4vf6h57nzda6r5gp4x5unzvpexv6kvdnpxdjnsd3svsexyep5xa3kycfexumrxvnrxcexgdecx4nrvwp4xvmkver9xccxxwrpxycnset9xgurjcnxxyervcqzzsxqzuysp57vz9e8v07c409khvs6ulzvsqsq3zxvd97harpjrv3gkprtnx8jss9qxpqysgqv859k3ganeehtuyjg2nlzsnl4xllk9vumpmphxr6e4j6wh83970j6xxcs4x3gwpztpexpxnq0a9umd45yzhgq8lu0gm0qlwr67zwslspa7s9uh