
**These Are America's Most Diverse Cities**
These Are America's Most Diverse Cities
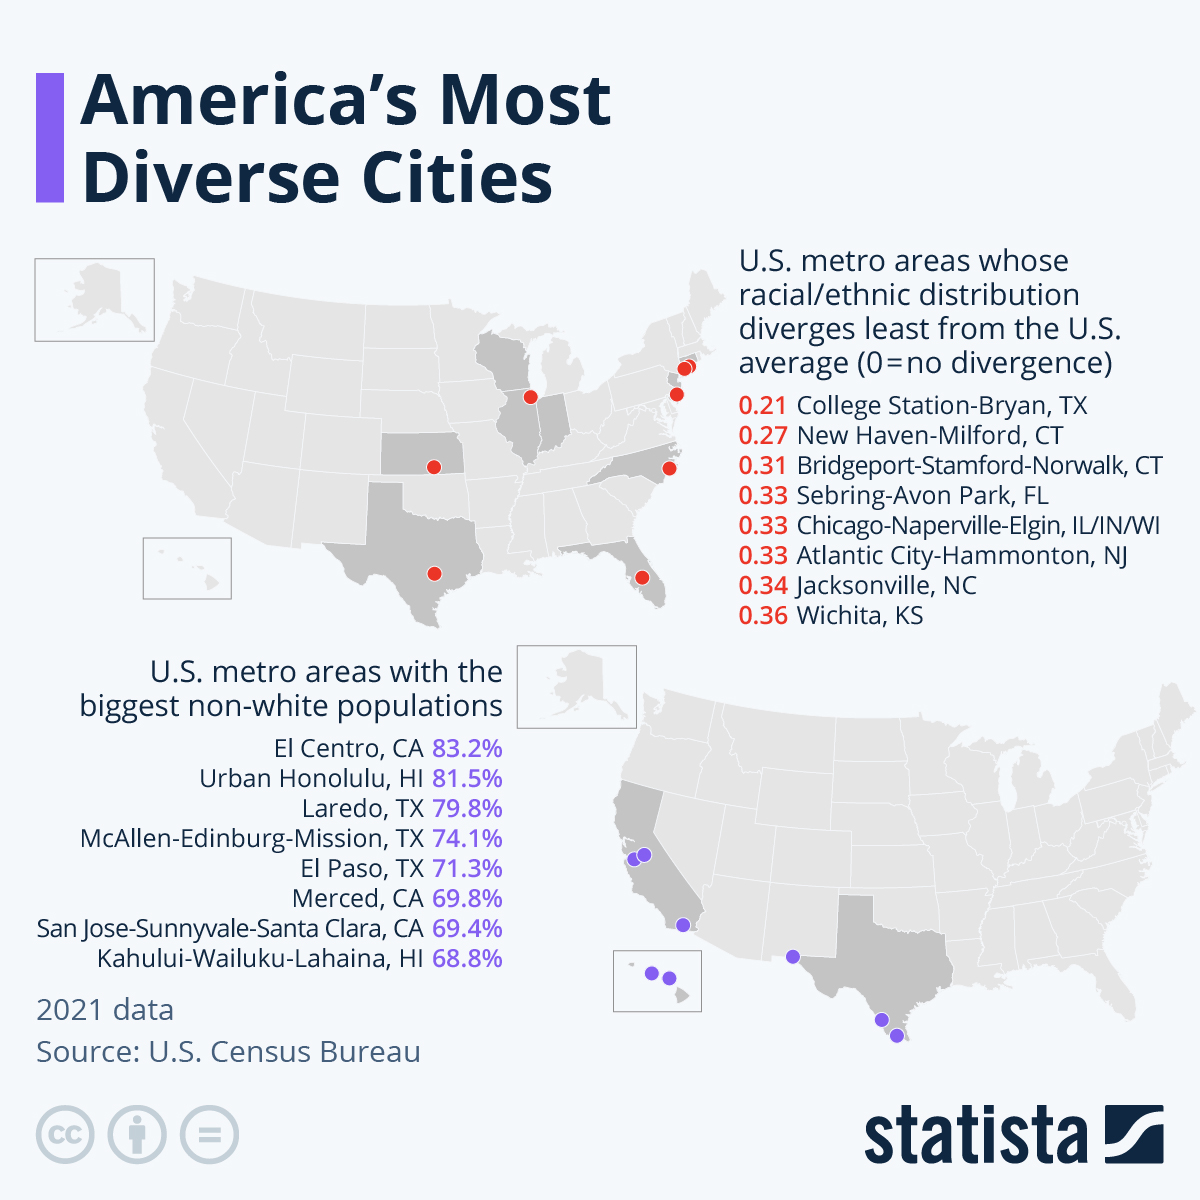
Which cities in the United States are the most diverse? It depends on the definition. As Statista's Katharina Buchholz details below (https://www.statista.com/chart/29721/americas-most-diverse-cities/), an analysis of American Community Survey data (https://data.census.gov/table?t=Populations+and+People&g=010XX00US,$31000M1&y=2021) shows that **the metro areas appearing most diverse at first glance might not be the most mixed places after all.**
Out of almost 400 metro areas listed with the Census Bureau in the 50 U.S. states, the ones where the biggest shares of the population identify as a race other than white can be found in California, Texas and Hawaii. **El Centro in California - registering the highest share of non-white population (https://www.statista.com/topics/776/population/) at 82.3 percent** \- as well as Laredo, McAllen-Edinburg-Mission and El Paso in Texas all hug the border with Mexico, which has led to especially high Latino populations in these places.
 (https://www.statista.com/chart/29721/americas-most-diverse-cities/)
_You will find more infographics at Statista (https://www.statista.com/chartoftheday/)_
According to the Census, **Latinos in the U.S. most often identify their race as "other" or "more than one race", while around 20 percent define their race as white.** This leads to the share of the Latino populations of the four aforementioned metros ranging between 83 percent in El Paso and a whopping 96 percent in Laredo. Urban Honolulu and the Kahului-Wailuku-Lahaina metro in Hawaii as well as San Jose-Sunnyvale-Santa Clara, Calif., meanwhile owe their high non-white populations to the concentration of another race: Asians. Their share ranges from 30 percent to 42 percent in these metros.
**However, does a high share of a single race or ethnicity other than white people constitutes true diversity?**
In another approach, an index score calculated by Statista measures the divergence of the racial and ethnic makeups of metro areas from the U.S. average. Here, **Texas' College Station-Bryan, a metro of around 270,000 people home to the flagship campus of Texas A&M University, is the city most closely matching the U.S. average.** The metro's white population stands at around 65 percent, a little higher than the 61.2 percent U.S. average. Apart from that, divergence remains under one percentage point for most races, with the notable exception of Latinos, whose share is 8 percentage points higher. But with white populations reaching as high as 72 percent (in the case of Wichita) within the top 8 of this index, it also is an imperfect way to measure diversity.
**Finally, a second index that combines both aspects - divergence from the U.S. average racial and ethnic distribution and divergence from the United States' most non-white metro - hits on more of the country's large cities.** The list is led by New York City, (https://www.statista.com/topics/9382/new-york-city/) followed by Washington D.C., Chicago, Atlantic City, NJ, and San Francisco. In the case of New York, a white population of around 46 percent, combined with somewhat elevated levels of inhabitants from all other races and ethnicities facilitates the top score. In ranks 6 to 8, Bridgeport-Stamford-Norwalk in Connecticut reappears, followed by Goldsboro, North Carolina, and Trenton-Princeton, New Jersey.
Tyler Durden (https://cms.zerohedge.com/users/tyler-durden)Sat, 04/15/2023 - 13:00
https://www.zerohedge.com/personal-finance/these-are-americas-most-diverse-cities