 #m=image%2Fjpeg&dim=1080x1079&blurhash=%7CnMt8XR*%3Fbs%3A-%3Bof%25fofxu%3FbjsRjazRjayV%40j%5BWB_NoKM%7BWVRQWVRjj%5BV%5BIAWVozoLofoLoffQofWXj%5BoKayj%5Bj%5Bayj%5BazD%25oft7WVt7WVofaykC-pa%7DRkjtWBj%5BWBayayozj%5BjZayayjtaya%7Cay%25MayWBbHWBfQWBj%5BWB&x=8035cb9b0857462eb51106f081db9e58768cb84a08b1bf5b4dcfd5995b932154
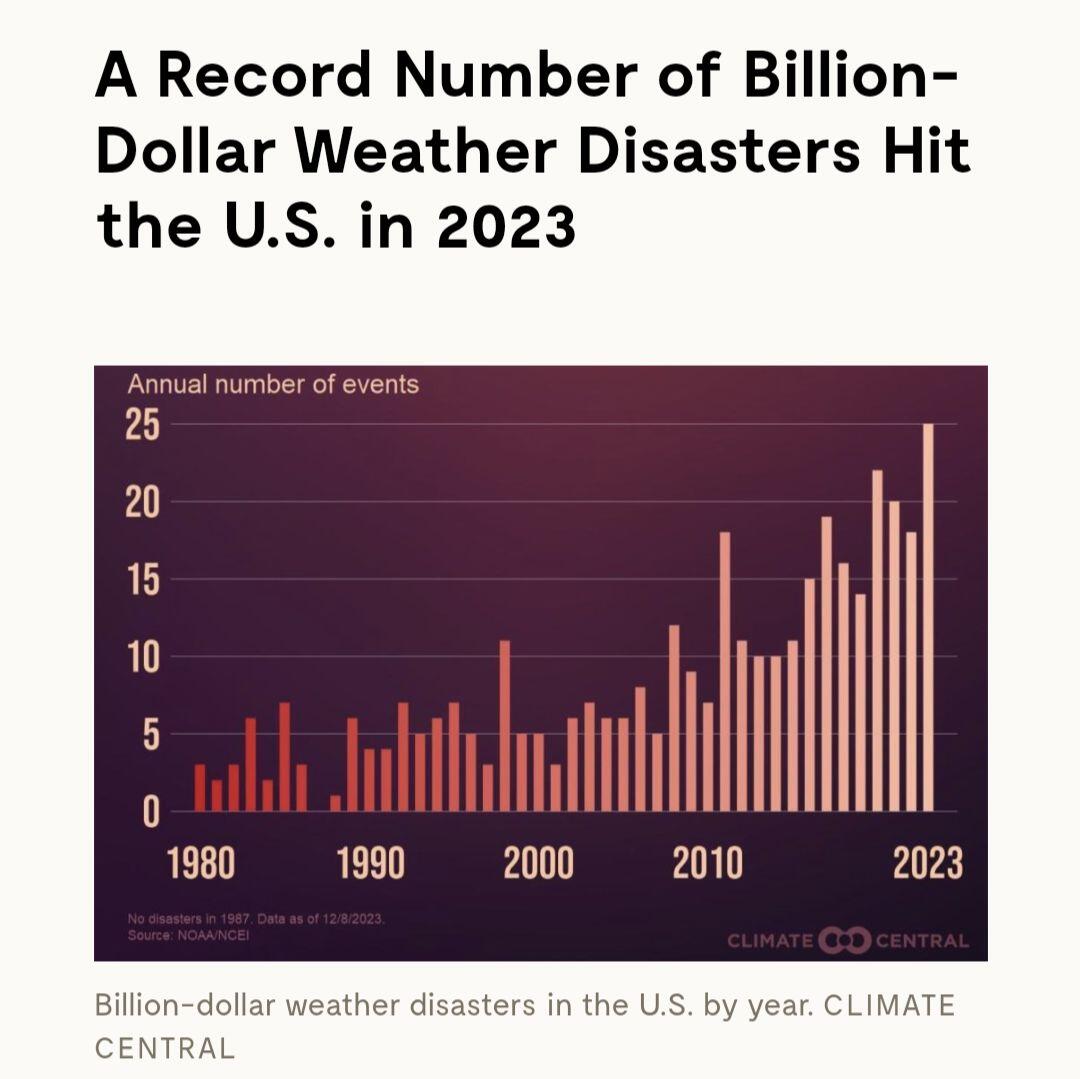
These graphs also have to be adjusted for how much built up infrastructure there is. As time has moved on, we built more and more stuff, so more stuff gets damaged now.
If you adjust for that and inflation, then the graph is flat.
These graphs also have to be adjusted for how much built up infrastructure there is. As time has moved on, we built more and more stuff, so more stuff gets damaged now.
If you adjust for that and inflation, then the graph is flat.
No replies yet.