
Daily Trade Setup doesn't have to be the same as the example. Feel free to adjust it according to your individual preferences.
BTCUSDT.P OKX Analysis ⚡
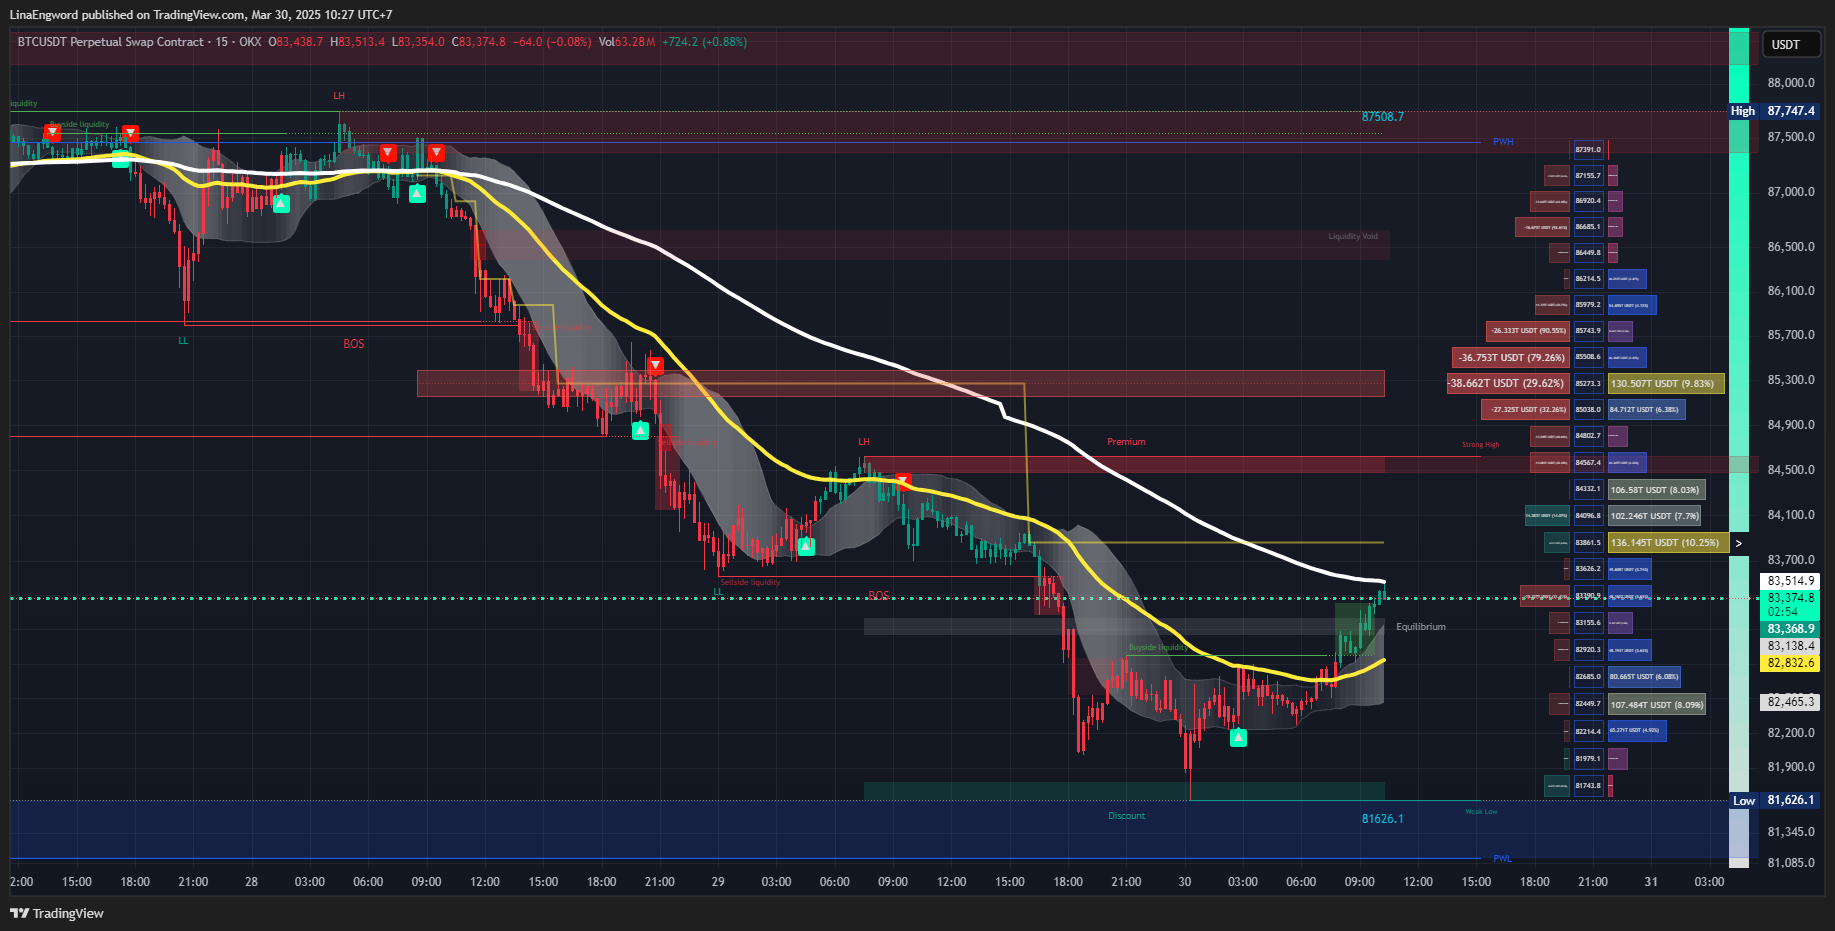
Data as of: March 30, 2025, 09.18 AM
Current Price: 83,175
PWH: 87,467.1
PWL: 81,125
Overall Market Analysis ⚡
Based on the provided 4-timeframe charts (15m, 1H, 4H, Day) and the utilization of various technical analysis tools, here's a comprehensive overview:
TF 15m (Short-term):
- High volatility, with price fluctuating within the PWH and PWL range.
- Both CHoCH Bearish and Bullish signals indicate market uncertainty.
- Buyside and Sellside Liquidity are relatively balanced.
- Money Flow is showing very erratic behavior.
- EMA: Price remains above the EMA 50 and 200, suggesting short-term bullish momentum.
- Trend strength : Showing un clear signals.
- Price pattern and chart pattern: Head and shoulders which indicate sell pressure.
TF 1H (Mid-term):
- Bullish momentum is showing signs of weakening.
- SMC and ICT: Showing BoS Bullish Signal.
- Sellside Liquidity outweighs Buyside Liquidity.
- Money flow: Showing a clear out flow of money.
- EMA: Price is above the EMA 50 and 200, but the EMA 50 is showing a potential downward crossover.
- Trend strength : Showing sell signals.
- Price pattern and chart pattern: Wedge pattern which indicates sell pressure.
TF 4H (Mid-to-Long-term):
- The overall trend is still bullish, but signs of a potential reversal are emerging.
- SMC and ICT : Showing BoS Bullish signal.
- Sellside Liquidity exceeds Buyside Liquidity.
- Money flow: Showing strong out flow of money.
- EMA: Price remains above the EMA 50 and 200.
- Trend strength : Showing clear sell signals.
- Price pattern and chart pattern: Double top which indicates sell pressure.
TF Day (Long-term):
- The overall long-term trend remains bullish.
- SMC and ICT : Showing BoS Bullish signal.
- Sellside Liquidity outweigh Buyside Liquidity.
- Money flow : Showing the money flow is decreasing in its out flow.
- EMA: Price is still above the EMA 50 and 200.
- Trend strength : Showing unclear signals.
- Price pattern and chart pattern: No clear pattern.
Trend Summary:
- Short-term (15m): High uncertainty.
- Mid-term (1H, 4H): Increasing sell pressure.
- Long-term (Day): Still bullish.
- Today's trend: Price correction downwards possible.
Overall: The BTCUSDT.P OKX market maintains a long-term bullish trend, but mid-term and short-term sell pressure is increasing. Be cautious of volatility and closely monitor potential price reversal signals.
Daily Trade Setups
Based on the analysis, here are three example trade setups:
Setup 1: Short Position (Short-term)
- Enter: 83,000
- TP: 82,000
- SL: 83,500
- RRR: 2:1
Explanation:
- Based on the CHoCH Bearish signal on the 15m timeframe and the Head and Shoulders pattern.
- Enter Trade once price reaches entry point, or set a sell limit order.
- Target price and stop loss levels set to manage risk.
Setup 2: Short Position (Mid-term)
- Enter: 84,000
- TP: 82,000
- SL: 85,000
- RRR: 2:1
Explanation:
- Based on the EMA 50 crossover on the 1H timeframe, wedge pattern, double top pattern, and sellside liquidity.
- Enter Trade once price reaches entry point, or set a sell limit order.
- Target price and stop loss levels set to manage risk.
Setup 3: Long Position (Long-term)
- Enter: 81,000
- TP: 85,000
- SL: 80,000
- RRR: 4:1
Explanation:
- Based on the long term bullish trend, and buyside liquidity.
- Enter trade once price reaches entry point or set a buy limit order.
- Target price and stop loss levels set to manage risk.
Disclaimer:
This analysis is for informational purposes only and does not constitute financial advice. Traders should conduct their own research and exercise caution.
Chart Images:
TF15m :
- Overview: 'https://www.tradingview.com/x/zZH7qx2f/'
- Trend line : 'https://www.tradingview.com/x/gapjvk6N/'
- SMC: 'https://www.tradingview.com/x/2zOJZasJ/'
- Buyside & Sellside Liquidity : 'https://www.tradingview.com/x/cWZkI9I7/'
- Money Flow : 'https://www.tradingview.com/x/TP1R19pb/'
- EMA : 'https://www.tradingview.com/x/2PjTfpD8/'
- Trend Strength:'https://www.tradingview.com/x/ma9CcDVx/'
TF1H :
- Overview: 'https://www.tradingview.com/x/9Unm6DQy/'
- Trend line : 'https://www.tradingview.com/x/k5rV4LTa/'
- SMC: 'https://www.tradingview.com/x/Qi4rR3gd/'
- Buyside & Sellside Liquidity : 'https://www.tradingview.com/x/6e9zJnlb/'
- Money Flow : 'https://www.tradingview.com/x/MBPvOHBs/'
- EMA : 'https://www.tradingview.com/x/UibnKYWX/'
- Trend Strength:'https://www.tradingview.com/x/hWEma6oC/'
TF4H:
- Overview: 'https://www.tradingview.com/x/vzdcuXED/'
- Trend line : 'https://www.tradingview.com/x/mPzd9G1I/'
- SMC: 'https://www.tradingview.com/x/1cdCMueI/'
- Buyside & Sellside Liquidity : 'https://www.tradingview.com/x/qPrgYAxX/'
- Money Flow : 'https://www.tradingview.com/x/6rTBagjl/'
- EMA : 'https://www.tradingview.com/x/sN6lG04y/'
- Trend Strength:'https://www.tradingview.com/x/hb457FLd/'
TF Day:
- Overview: 'https://www.tradingview.com/x/y1MOI5Y7/'
- Trend line : 'https://www.tradingview.com/x/qy4YSuPg/'
- SMC: 'https://www.tradingview.com/x/mqFabKZh/'
- Buyside & Sellside Liquidity : 'https://www.tradingview.com/x/U9X7H7NR/'
- Money Flow : 'https://www.tradingview.com/x/CV3bVn5g/'
- EMA : 'https://www.tradingview.com/x/7uHK3Din/'
- Trend Strength:'https://www.tradingview.com/x/X61mSfbO/'
Discussion
No replies yet.