
Why does it go down?
Discussion

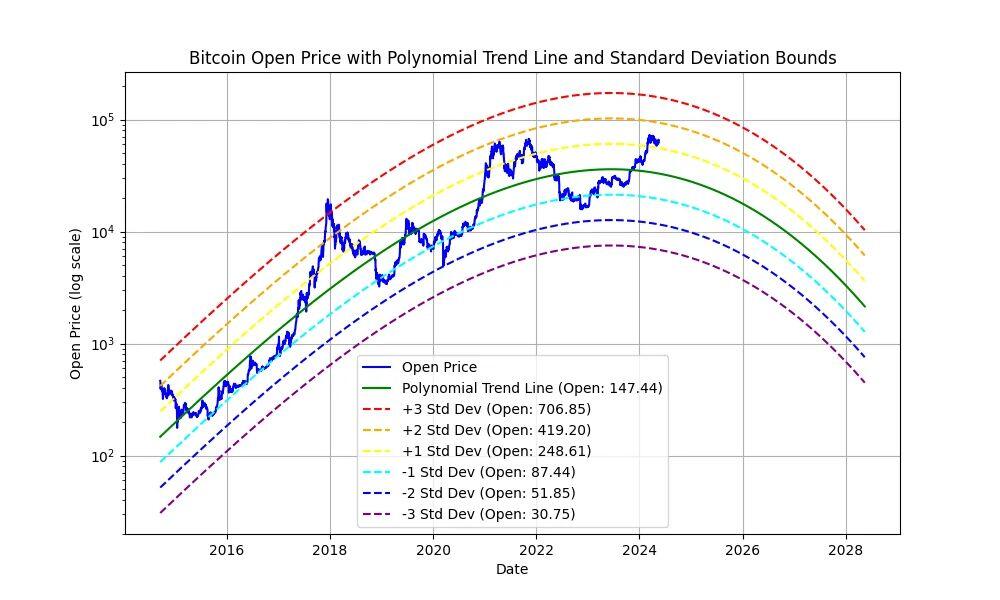
I was just fitting the data to a polynomial line.
I think the bitcoin rainbow charts work the same way. It shows bitcoin is starting to level off.
I can show you the source code if you want to check.
Why does it go down?
I was just fitting the data to a polynomial line.
I think the bitcoin rainbow charts work the same way. It shows bitcoin is starting to level off.
I can show you the source code if you want to check.