Bitcoin. Green Dots.
Line them up.
Hold on to your butts.
The run has begun.
Bitcoin. Green Dots.
Line them up.
Hold on to your butts.
The run has begun.
✅ EtherFi Airdrop Is Live!.
👉 https://telegra.ph/EtherFi-05-03 Claim your free $ETHFI.
I’m ready captain 👨✈️
Nice, I love charts without labels! Lol
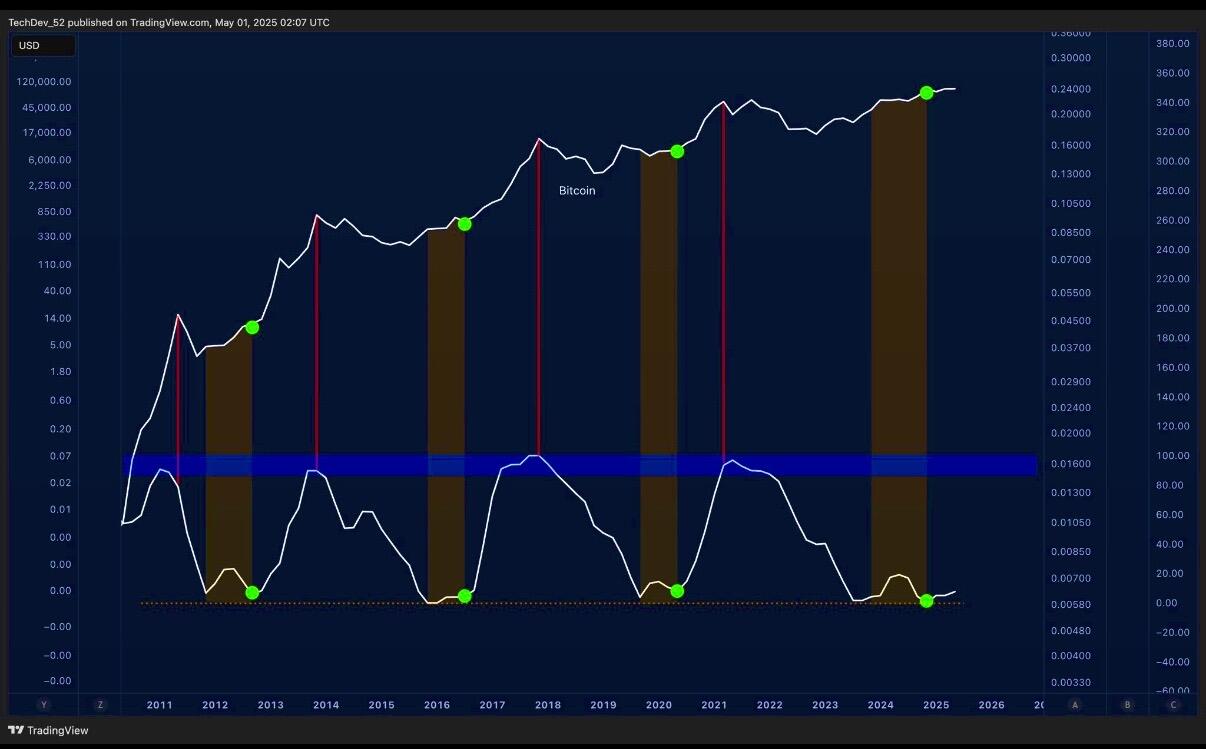
What is the bottom line? What are the green dots? What arw the shaded areas?
chart, courtesy of @TechDev_52,
focuses on the Relative Strength Index (RSI) bottom line
A green dot indicates a bear market bottom. The vertical shading highlights the time elapsed between this RSI bear bottom and a subsequent retest/second bottom
before a significant price movement