
**Bank of America Jumps On Blowout Earnings As Big Banks Feast On Small Bank Corpses**
Bank of America Jumps On Blowout Earnings As Big Banks Feast On Small Bank Corpses
In a zero sum world where the devastation among the small and regional banks means larger banks get bigger and more profitable, we doubt it will come as a surprise that Bank of America followed in JPMorgan's footsteps and reported blowout Q1 earnings this morning, beating across the board, with revenue boosted not only by soaring Net Interest Income but also by solid earnings across the bank's various trading operations.
Here are the main highlights from BofA's Q1 earnings:
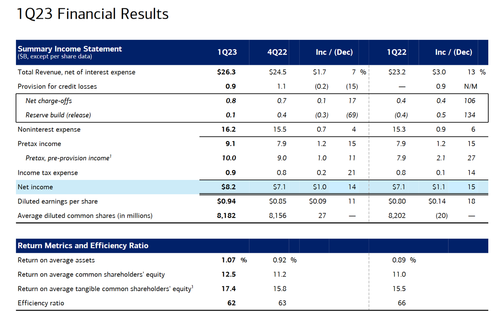
- EPS 94c, Exp. 84c, up 18% or 14c from 80c y/y
- Revenue net of interest expense $26.26 billion, +13% y/y, _**beating**_ estimate $25.4 billion
- Trading revenue excluding DVA $5.05 billion, +8.7% y/y, _**beating**_ estimate $4.46 billion
- FICC trading revenue excluding DVA $3.43 billion, +29% y/y, _**beating**_ estimate $2.62 billion
- Equities trading revenue excluding DVA $1.62 billion, -19% y/y, _**missing**_ estimate $1.8 billiom
- Wealth & investment management total revenue $5.32 billion, -2.9% y/y, _**missing**_ estimate $5.48 billion
- Net interest income FTE $14.58 billion, +25% y/y, estimate $14.42 billion
Of note, revenue from FICC (fixed-income, currencies and commodities trading) unexpectedly rose almost 30% to $3.43 billion as clients reacted to changing interest rates, the bank said. That helped the bank top analysts’ estimates for earnings per share.
 ?itok=EEBPp67x (
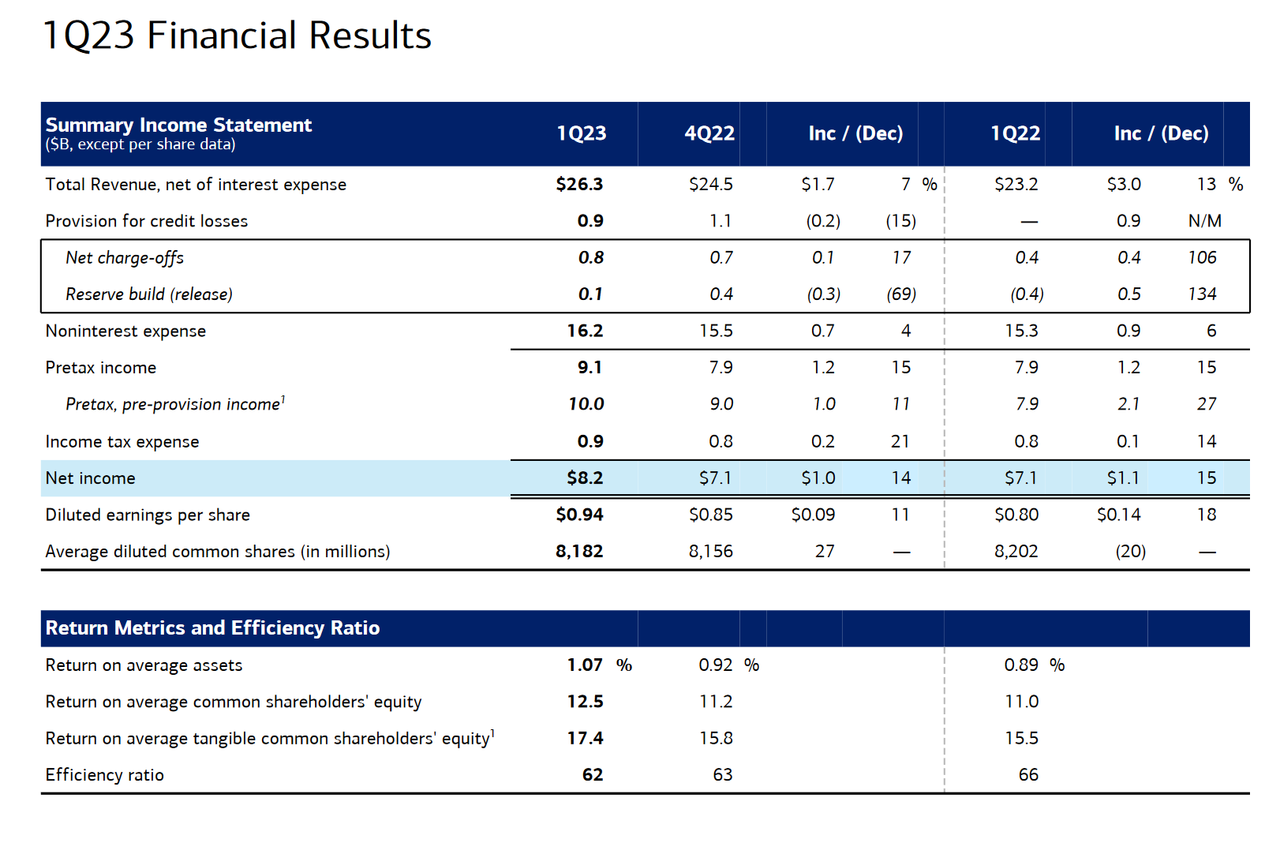 ?itok=EEBPp67x)
Some more balance sheet stats:
- Return on average equity 12.5%, estimate 10.9%
- Return on average assets 1.07%, estimate 0.92%
- Return on average tangible common equity 17.4% vs. 15.5% y/y, estimate 15.4%
- Basel III common equity Tier 1 ratio fully phased-in, advanced approach 12.9% vs. 12% y/y, estimate 12.6%
- Standardized CET1 ratio 11.4% vs. 10.4% y/y, estimate 11.3%
- Efficiency ratio 61.5%, estimate 63.1%
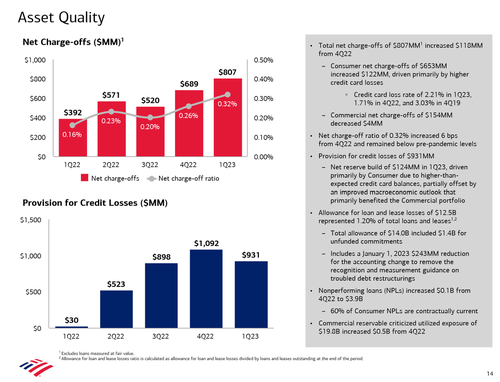
On the bad debt side, things were bad, but not as bad as consensus expected, with the bank reserving a $931 million provision for credit losses vs. $30 million y/y, but below the $1.092 billion in Q4'22 and _**smaller**_ than the estimate $1.18 billion. According to BofA, the net reserve build of $124MM in 1Q23, was driven primarily by Consumer "due to higher-than-expected credit card balances, partially offset by an improved macroeconomic outlook that primarily benefited the Commercial portfolio." In total, net reserve build of $360 million, driven primarily by higher-than-expected credit card balances.
Notably, the provision for credit losses reflected a benefit of $237 million, **driven primarily by an improved macroeconomic outlook,** and decreased $402m from 1Q22 as the prior year was impacted by reserve builds. At the same time, provisions in the consumer unit were up a lot more than expected though. They came in at $1.089 billion, compared with the $946 million analysts were calling for.
The net charge-offs meanwhile rose to $807 million vs. $392 million y/y and $689 million q/q, modestly above the estimate $782.6 million. According to BofA, consumer net charge-offs of $653MM increased $122MM, driven primarily by higher credit card losses; overall, the credit card loss rate rose to 2.21% in 1Q23, 1.71% in 4Q22, and 3.03% in 4Q19. Curiously, commercial net charge-offs of $154MM decreased $4MM; the net charge-off ratio of 0.32% increased 6 bps from 4Q22 and remained below pre-pandemic levels.
Finally, BofA's total allowance for loan and lease losses of $12.5B represented 1.20% of total loans and leases. The total allowance of $14.0B included $1.4B for unfunded commitments, and includes a January 1, 2023 $243MM reduction for the accounting change to remove the recognition and measurement guidance on troubled debt restructurings. Also of note, **nonperforming loans (NPLs) increased $0.1B from 4Q22 to $3.9B, while commercial reservable criticized utilized exposure of $19.8B increased $0.5B from 4Q22.**
 ?itok=KW32U6JD (
 ?itok=KW32U6JD)
A drill down into BofA's consumer and commercial portfolios is shown below:
 ?itok=OxHO3f9_ (
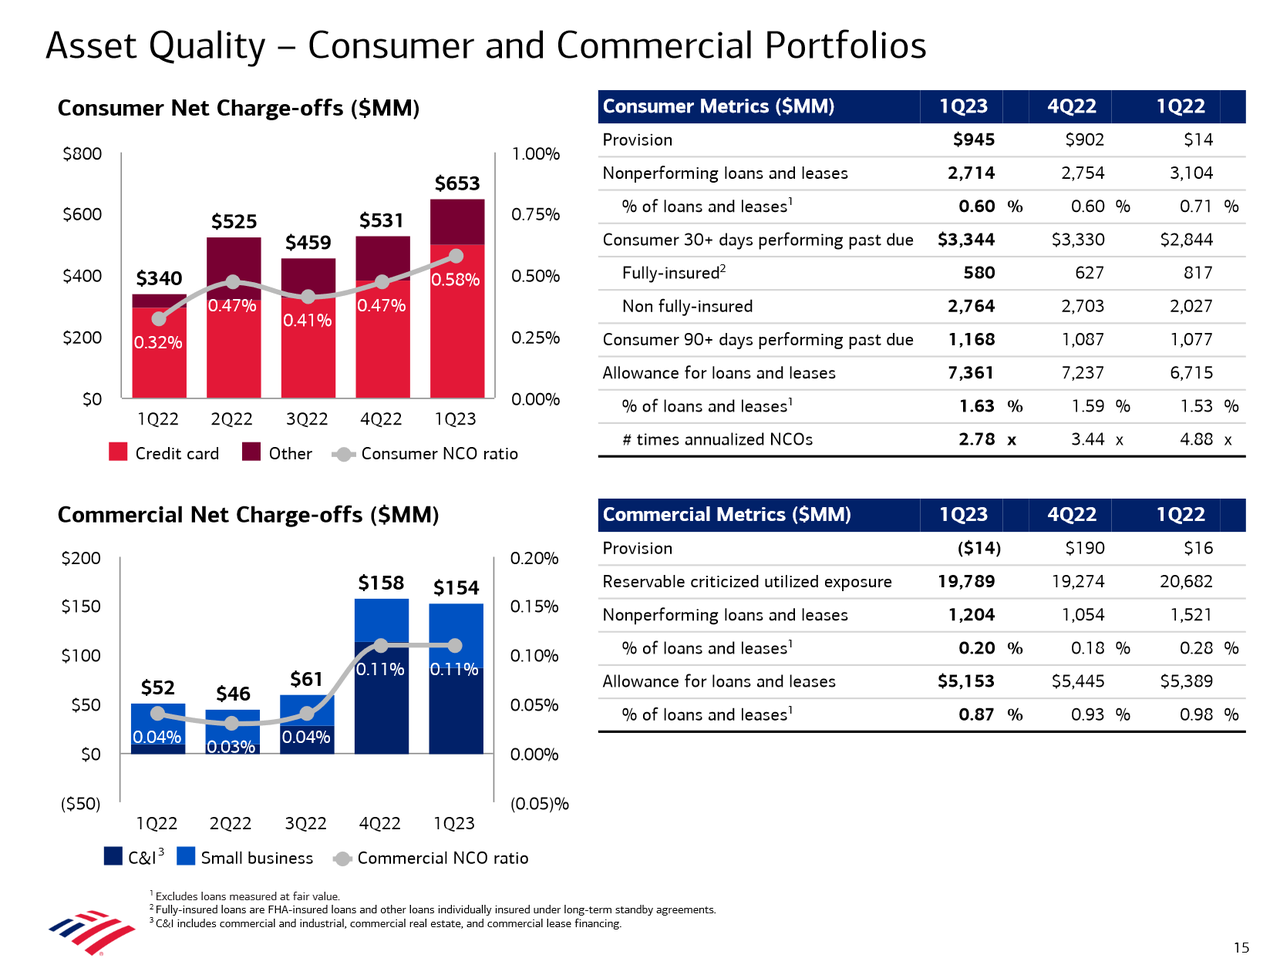 ?itok=OxHO3f9_)
Turning to BofA's Net Interest Income, it rose a whopping $2.9BN or 25% Y/Y to $14.4B ($14.6B FTE), translated into a net interest yield 2.2% vs. 1.69% y/y (in line with the estimate of 2.21%) and wa…