
#BitcoinPowerLaw 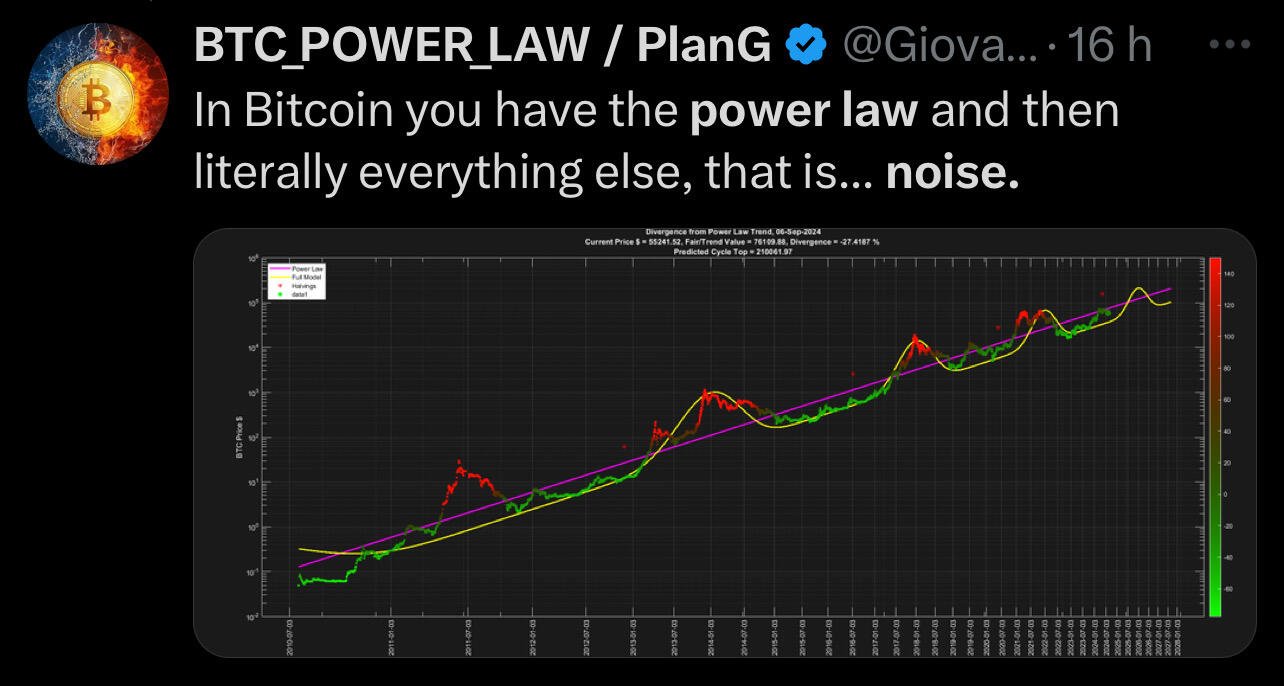
Discussion

Did my own using weekly date. My own stock to flow data. LogLog is how you should view bitcoin. I'm convinced. I love it.
Divide the cycles up into 1/3s but in log time. Made my own upper and lower bounds. Made my own tightening upper bound. Learned some stuff.
I really like the idea of dividing cycles into 1/3 via log scale. It talks to me. Early cycle high seems to land at 1/3 log time each cycle. Then heads lower seems to start regaining it's footing 2/3 log time. Forget what it was but new ath usual comes at 1/6 log time or 1/9th. Anywhere, think it was calling for 1st week in October but not exact to the week. I'm saying by week 3 we should be in new territory. 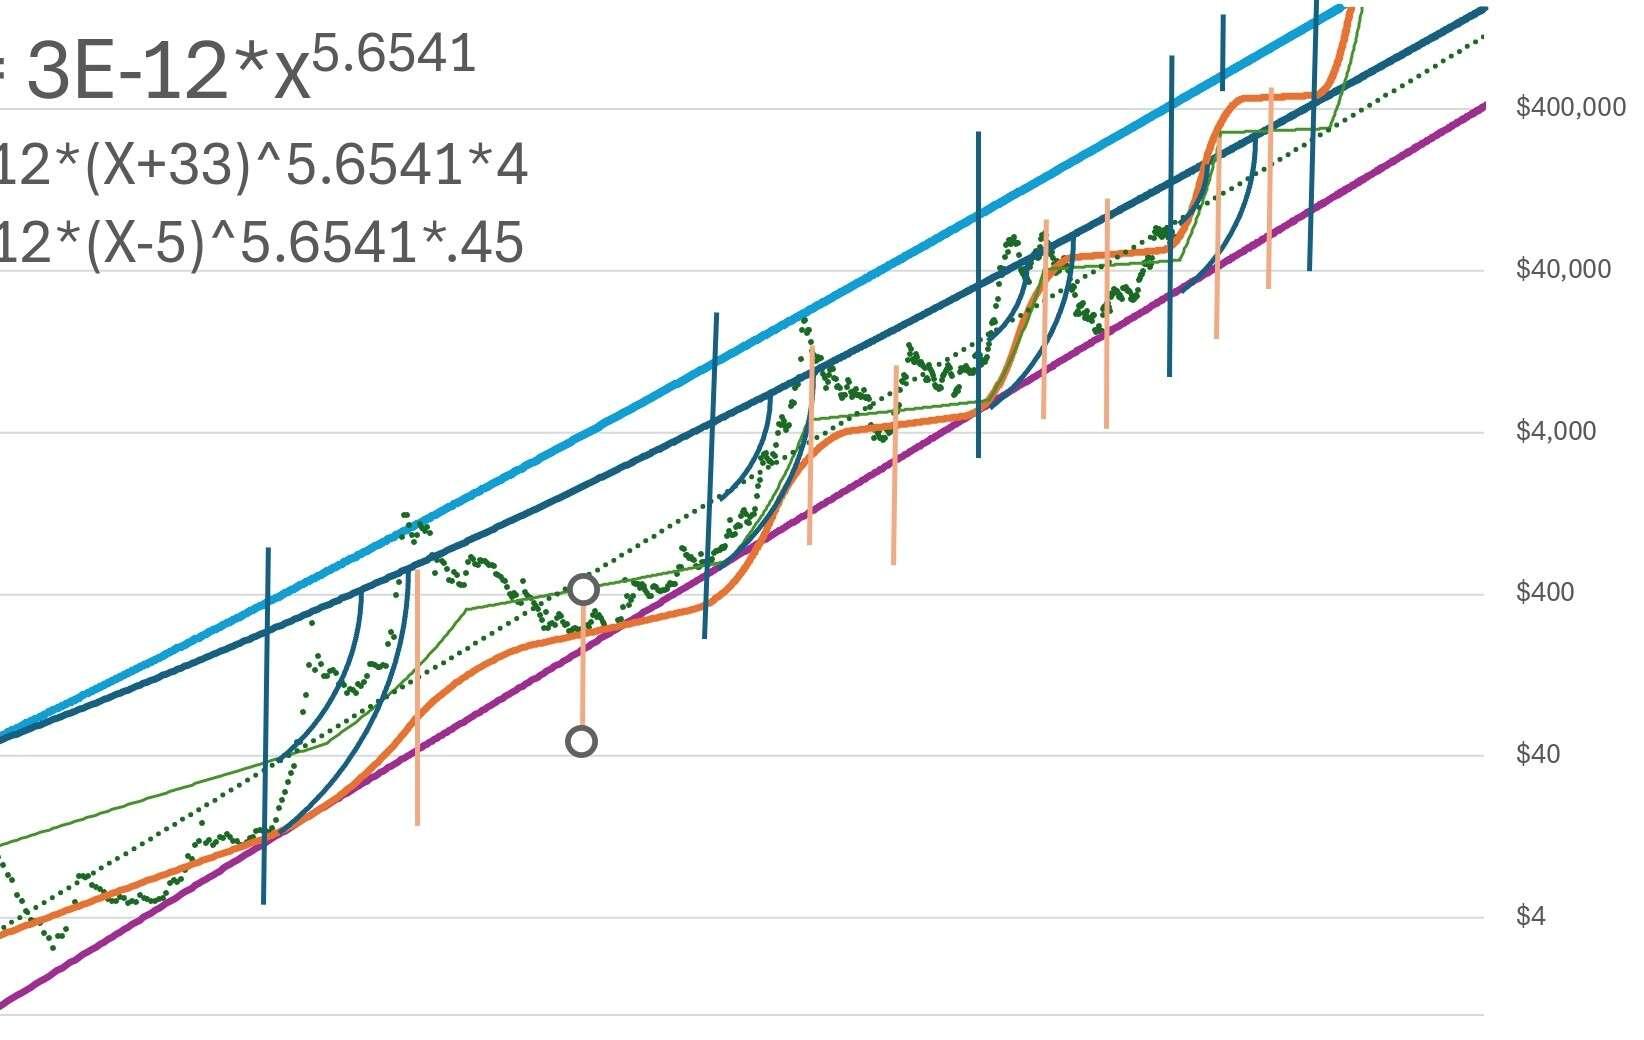
But the powerlaw is not stock to flow
Correct, I just stuck a bunch of stuff I was interested in on there. Trying to gain some incite.
That stock to flow line is derived by log log stock2flow (below) vs price trend line with a .77=r^2 (power law). So idk. The maths says that stock to flow is having more of an impact than the power law .70=r^2.
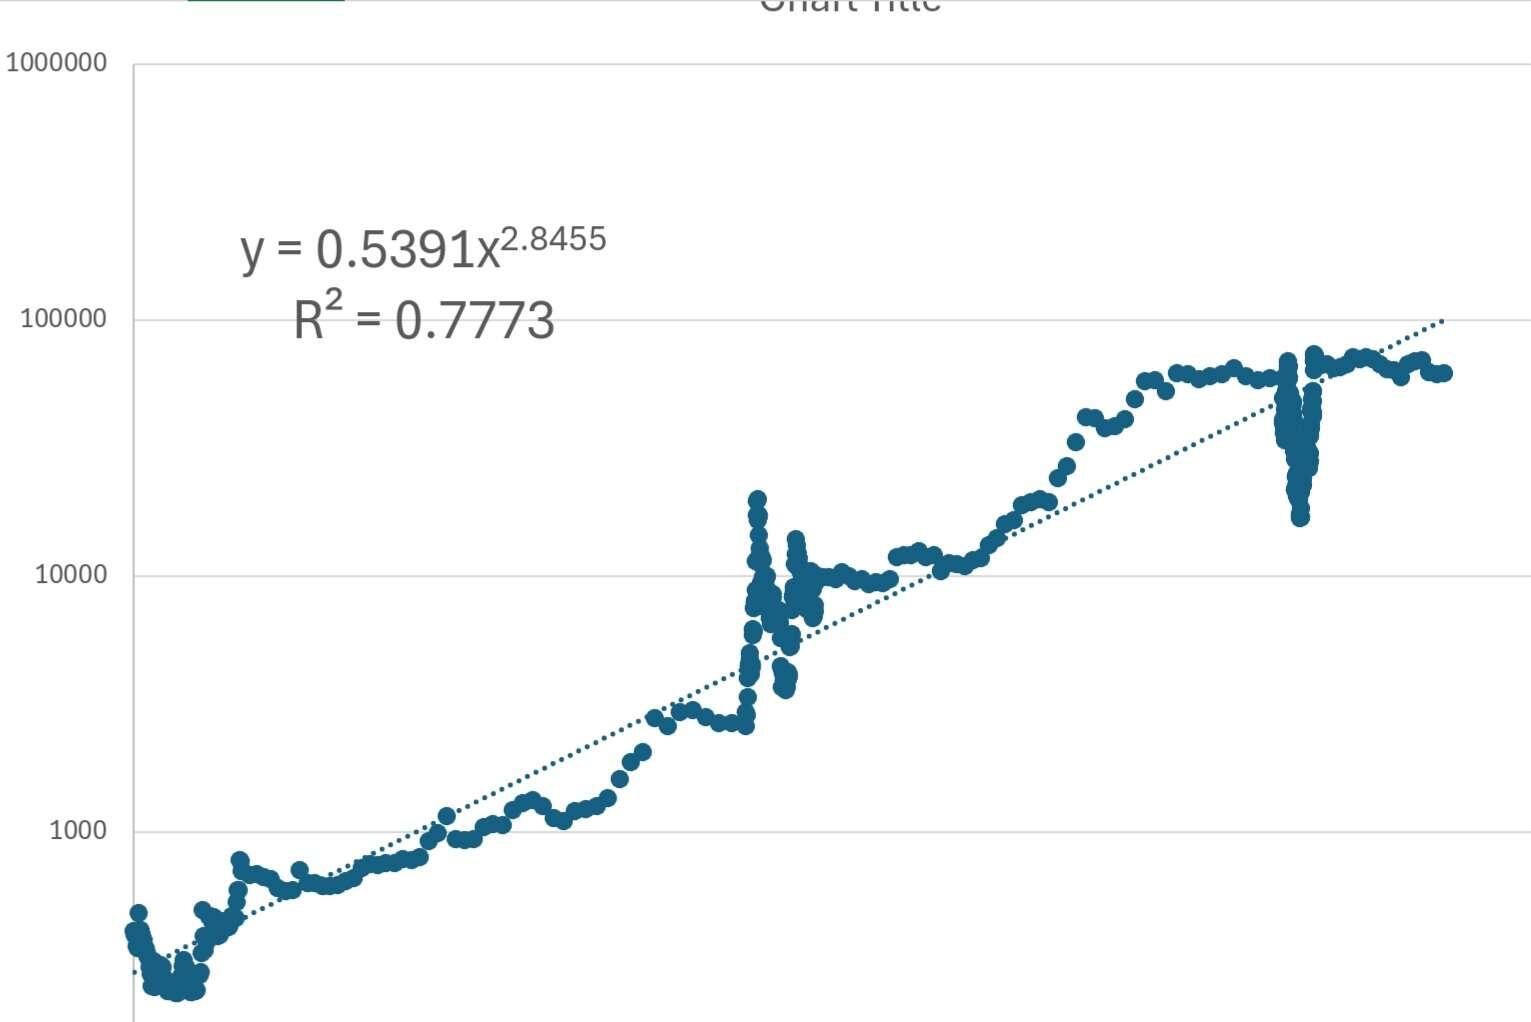
Green dotted line straight down the middle is power law trend line r^2=.7004. The orange was the stock2flow equation I got plotting stock to flow vs price loglog trendline and converting to price predictions on a time axis because i can predict where s2f will be at time x fairly well r^2=.7773.
The green one was me tinkering with a coefficient and a dampener. Sort of BS just messing with numbers to make it look like it fits better and looks more reasonablegoing forward. Not letting the numbers tell me. Soooo, BS. 😆
Idk. I like messing around in excel and seeing how people come up with the crap in their youtubes or blogs or whatever.