
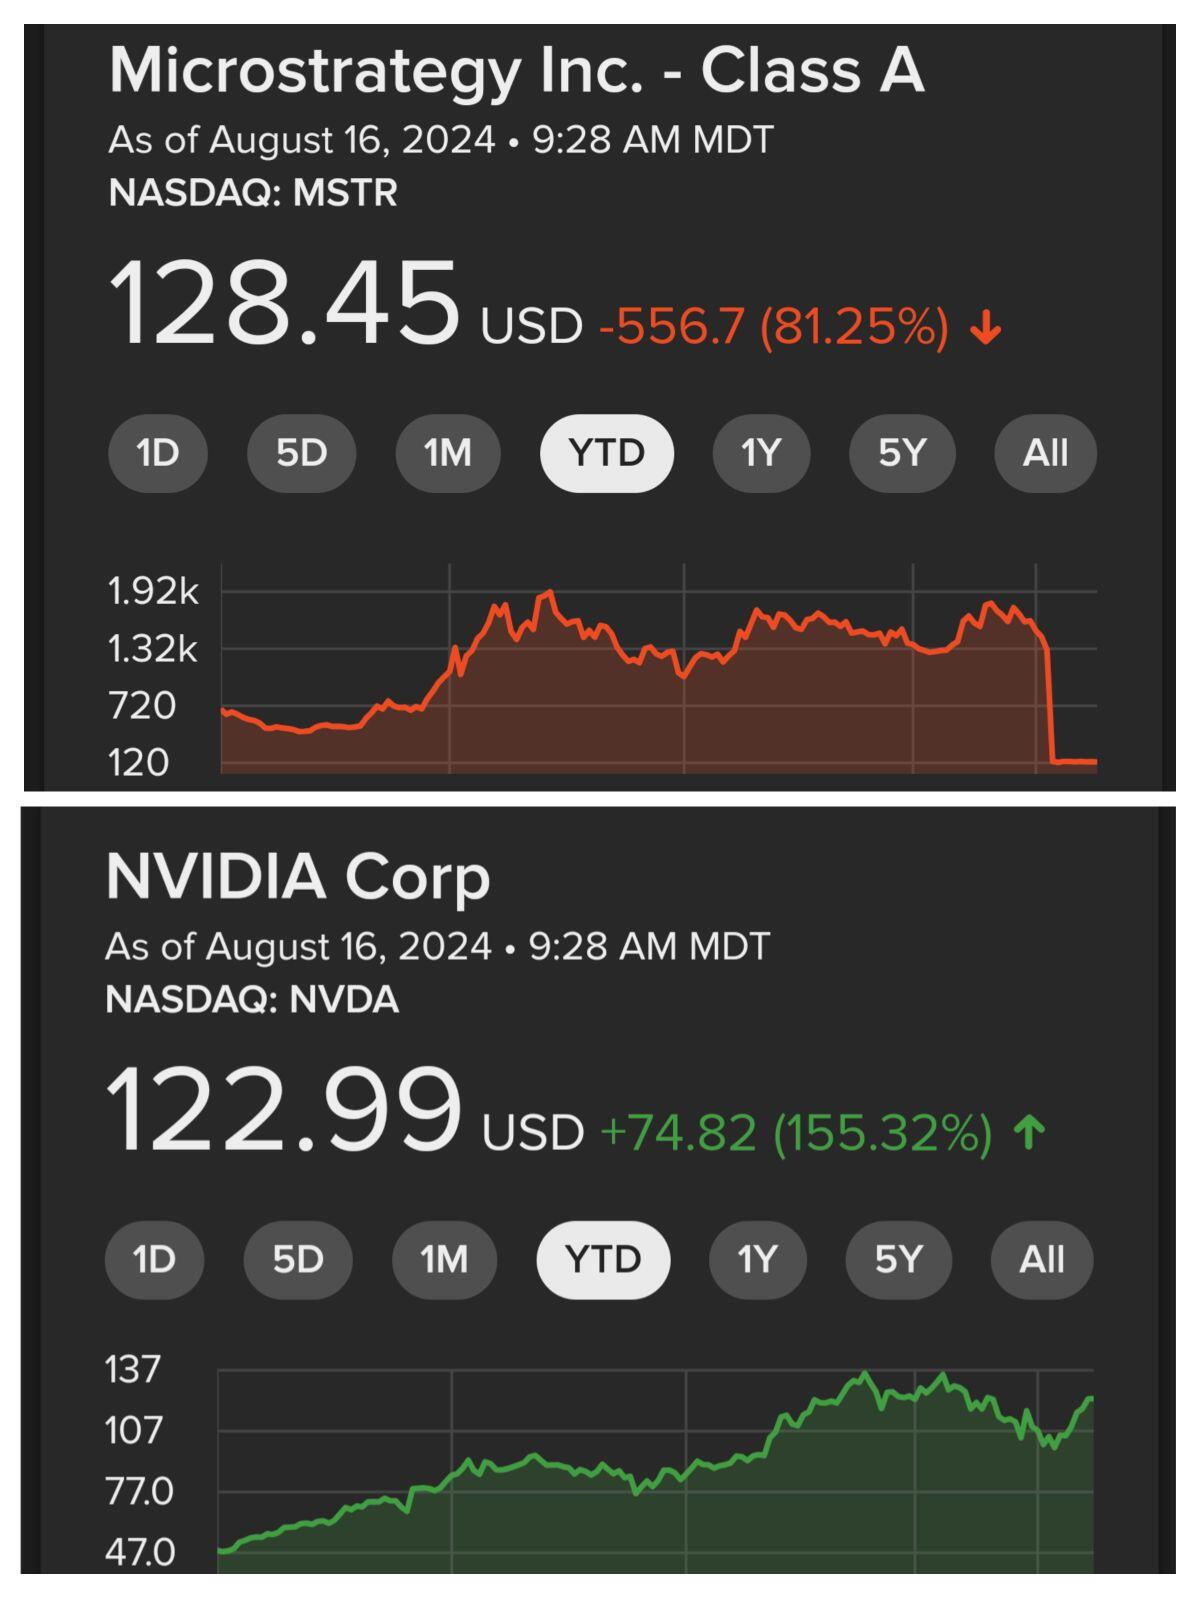
Both of these stocks "split" so why do these charts look so different?
I'm confused, what's new.
Both of these stocks "split" so why do these charts look so different?
I'm confused, what's new.
I still have no idea what microstrategy does, but I know what Nvidia does and AI is in the news all the time.
When did Nvidia split and by how much? Mate was 1 to 10 split.
because mstr follows btc and that is what btc has done
No, the dropp on that chart is the split
where's the nvda split then?
I don’t think splits show up on charts. This has always bothered me actually, everything adjust retroactively. So if you bought something at $1000 and it splits 10:1 it looks like you bought it at $100
As someone else said, i think something’s simply broken with the top MSTR chart in that image