
I have ~ no trust in the stats
There's no way these changes in variability are a real effect
I have ~ no trust in the stats
There's no way these changes in variability are a real effect
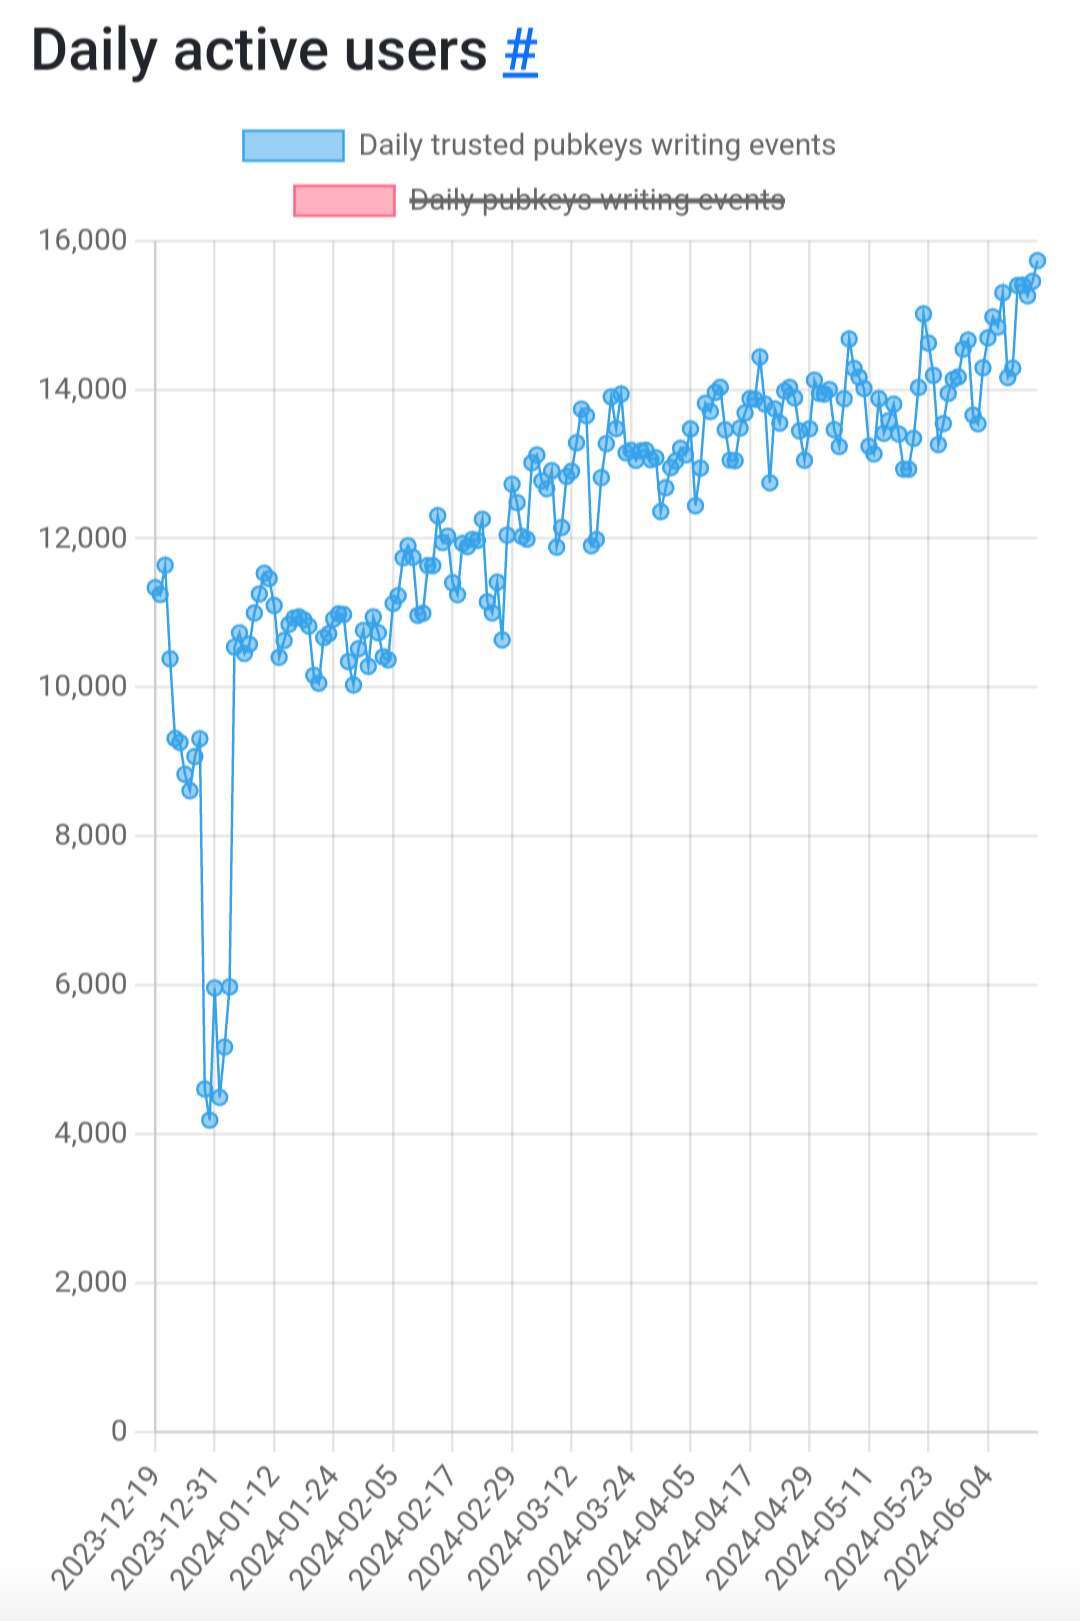
That chart is only in 5k increments. It checks out.
I mean the day-to-day variability
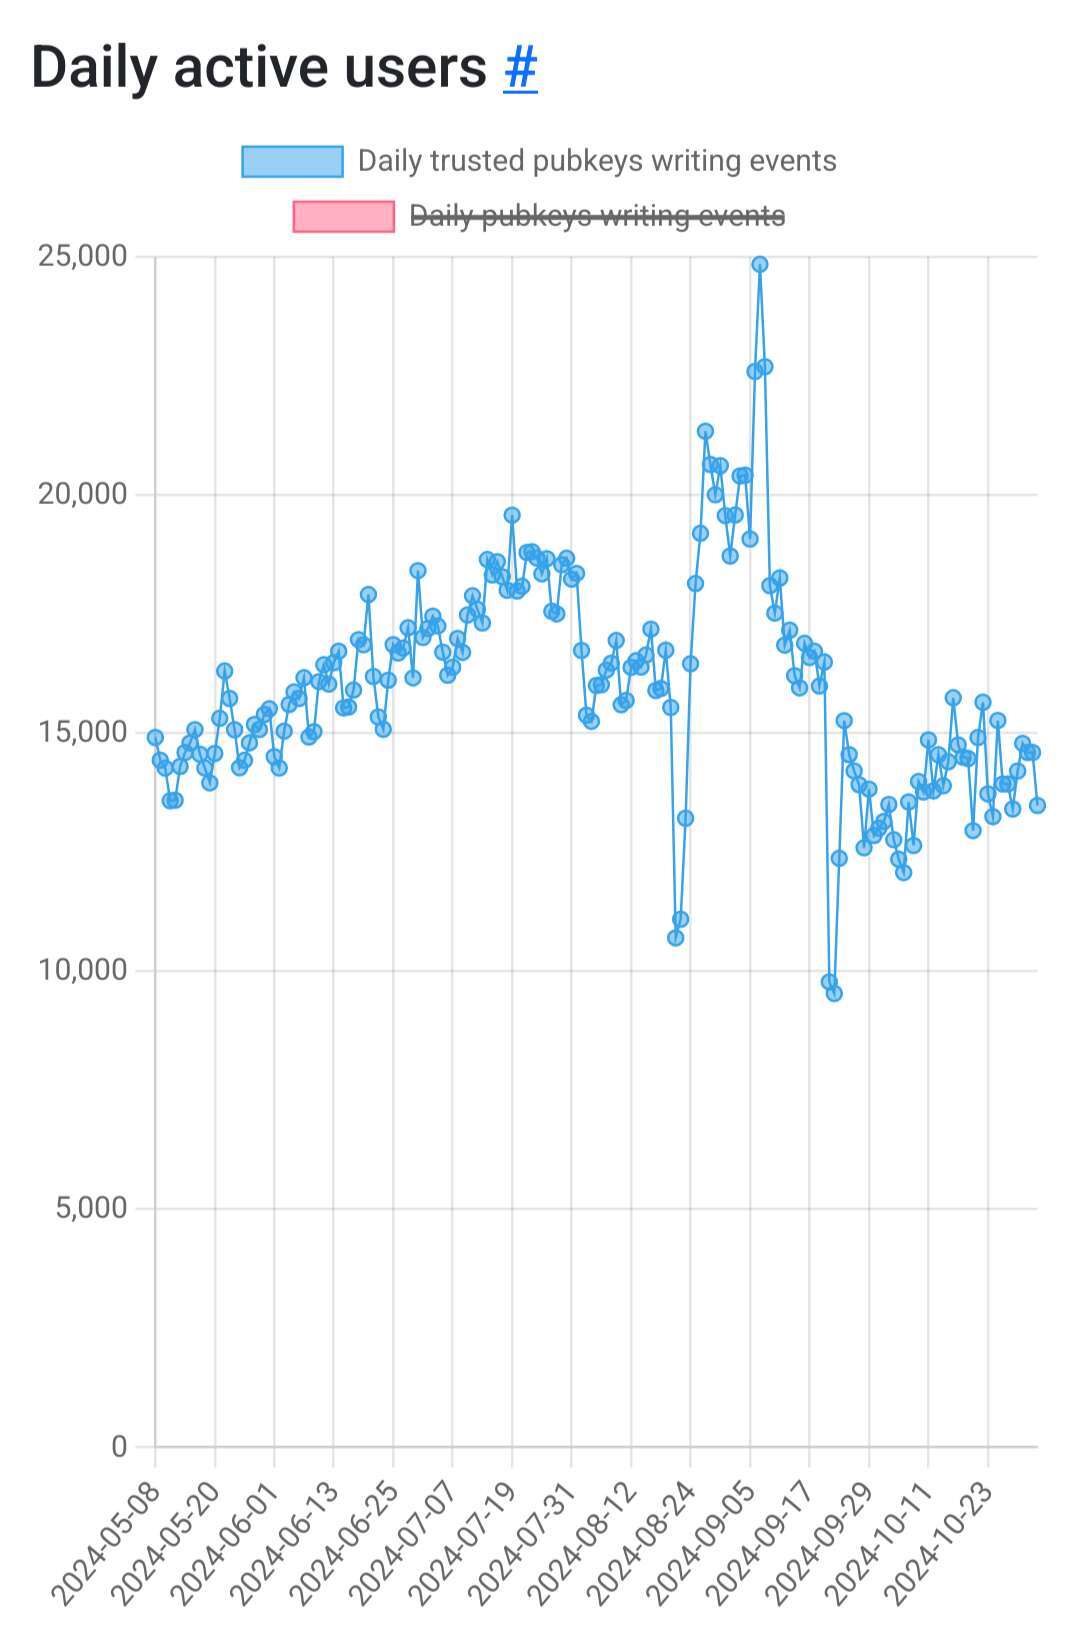
Prior to end of August you've got an eyeball variance of +/- 500 per day at the 95% confidence interval, superimposed on a linear trend
That started in January and lasted for 8 months
Then there's a step change to +/- 7,000 per day superimposed on I don't even know wtf to call that, which lasted about 2 months
Now it looks like we're back to +/- 500
I can't think of a reasonable model of human behaviour that would produce 10-fold step changes in variance
