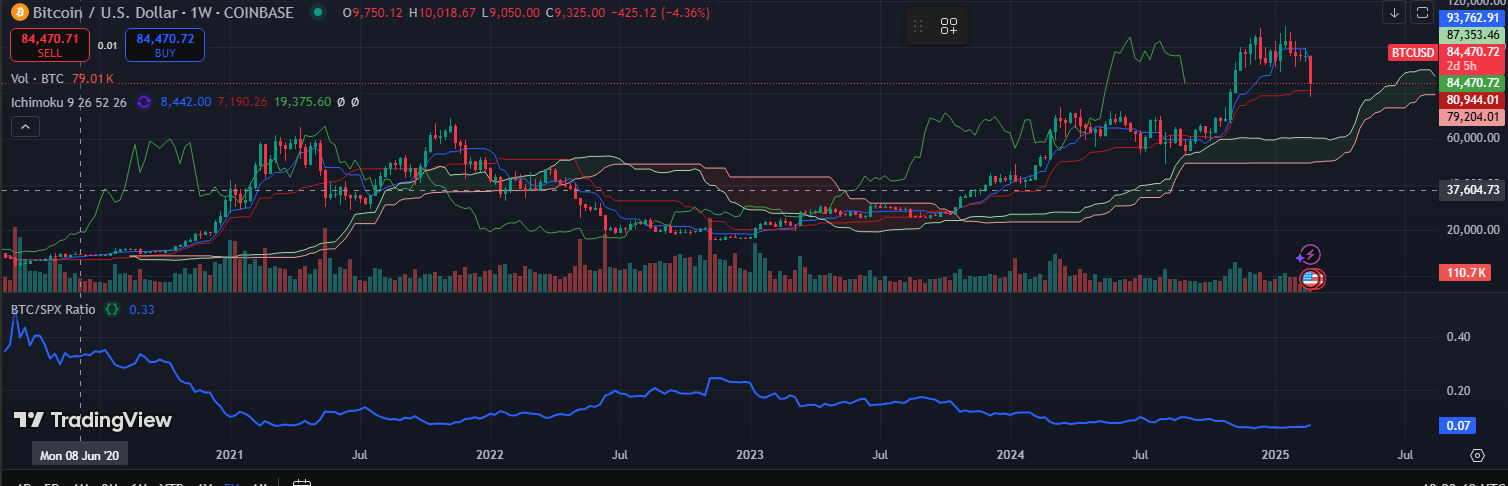

With a few modifications, we get it with Ichimoku clouds, measured out to the satoshi.
//@version=5
indicator("SPX/BTC Ratio with Ichimoku", overlay=false, precision=8)
// Get BTC and SPX data
btc = request.security("BTCUSD", timeframe.period, close)
spx = request.security("SPX", timeframe.period, close)
// Calculate the ratio
ratio = spx / btc
// Ichimoku settings
conversionPeriods = input(9, "Conversion Line Length")
basePeriods = input(26, "Base Line Length")
laggingSpan2Periods = input(52, "Leading Span B Length")
displacement = input(26, "Displacement")
// Function to calculate average of highest and lowest
donchian(len) => (ta.highest(ratio, len) + ta.lowest(ratio, len)) / 2
// Ichimoku components applied to the ratio
conversionLine = donchian(conversionPeriods)
baseLine = donchian(basePeriods)
leadLine1 = (conversionLine + baseLine) / 2
leadLine2 = donchian(laggingSpan2Periods)
// Plot the ratio and Ichimoku components
plot(ratio, title="BTC/SPX Ratio", color=color.blue, linewidth=2)
plot(conversionLine, title="Conversion Line", color=color.blue)
plot(baseLine, title="Base Line", color=color.red)
p1 = plot(leadLine1, title="Leading Span A", color=color.green, offset=displacement)
p2 = plot(leadLine2, title="Leading Span B", color=color.red, offset=displacement)
fill(p1, p2, color=leadLine1 > leadLine2 ? color.green : color.red, transp=80, title="Cloud")
plot(ratio, title="Lagging Span", color=color.purple, offset=-displacement)
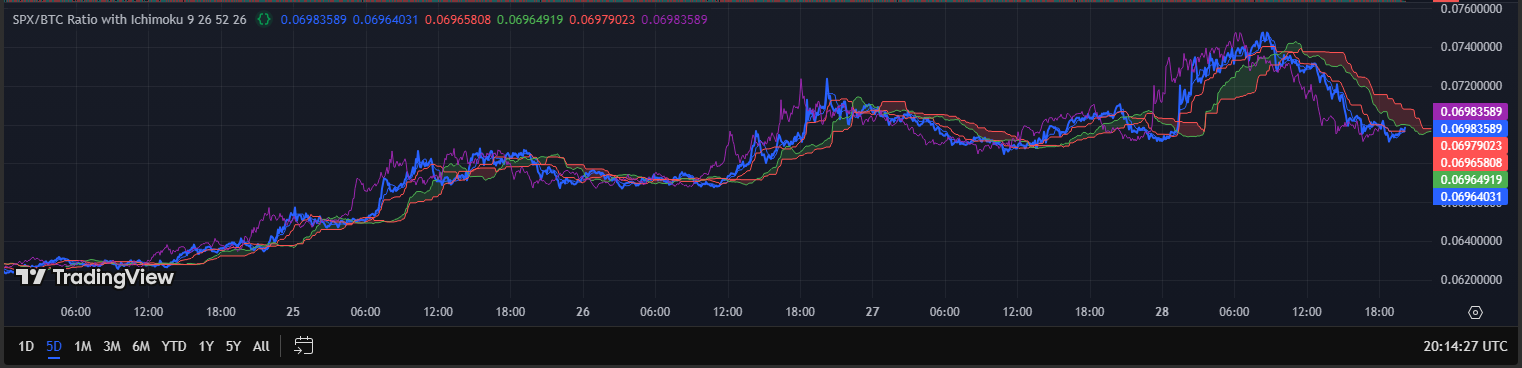
And yes, if you read Ichimoku clouds, the price being below a red cloud does mean that on this 5 day chart, the SPX is generally expected to underperform the BTC price in the near term. Just in case the $5,000 upswing today left you needing confirmation.