Your hourly dose of #Bitcoin facts
💵 PRICE:
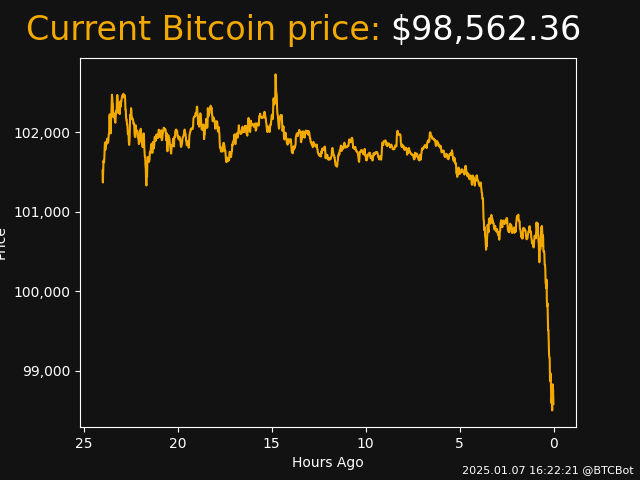
• Binance: $98,562.36
• Coinbase: $98,536.91
• Moscow Time: 10:15
• 24h High: $102,724.38
• 24h Low: $98,500.00
• Change last 1h: $-2,099 (-2.09%)
• Change last 24h: $-2,933 (-2.89%)
📈 MARKET:
• Bitcoin Market Dominance: 57.73%
• Volume (24h): $47,330,672,618
• Market Cap $1.9500 Trillion
🔗 BLOCKCHAIN:
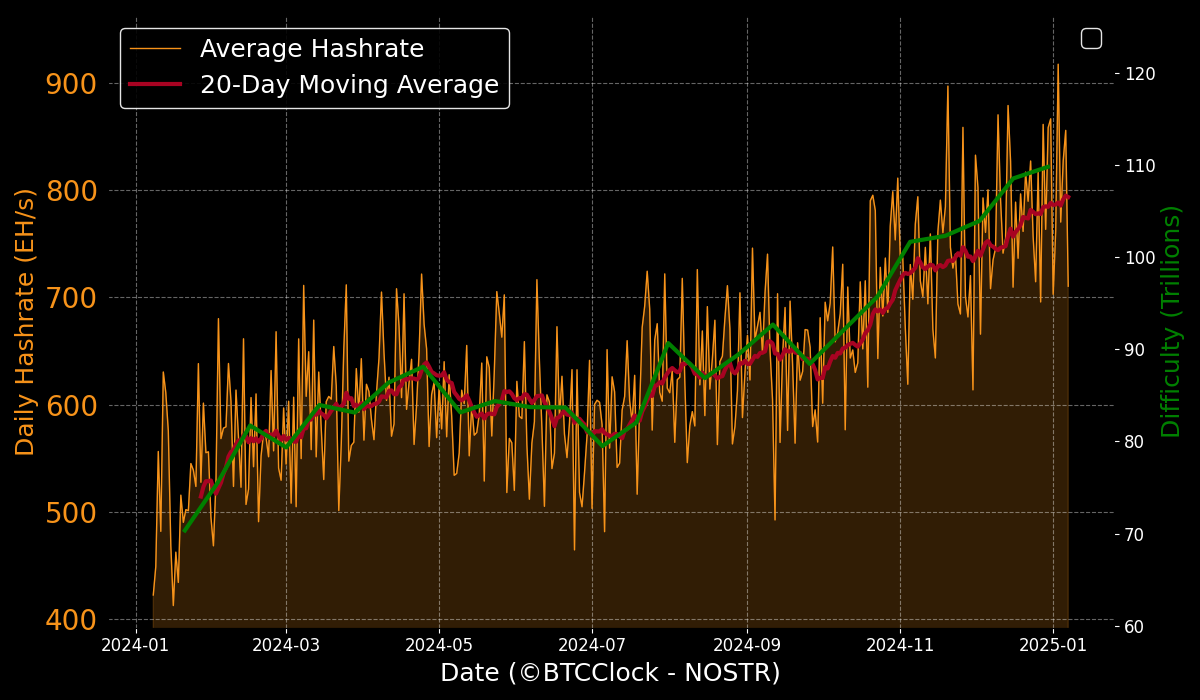
• Hashrate: 803.53 EH/s
• Current block height: 878,240
• Circulating Supply: 19,806,981
• Number of Inscriptions: 82,411,127
⛏️ MINING:
• Transactions in mempool: 184,239
• Block queue in mempool: 62
• Time since last block: 2m 18s
• Avg. block time (m) last 24h: 10.99
• Current subsidy: 3.125 BTC
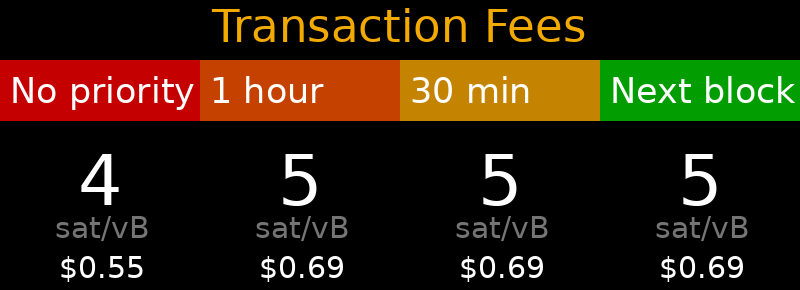
💰 FEES + SUBSIDY:
• Last block: 3.187 BTC
• Average last 24 hours: 3.295 BTC
• Average last 3 days: 3.170 BTC
⚡ LIGHTNING NETWORK:
• Capacity: 5,017.34 BTC
• Nodes: 11,890 (21 new 24h)
• Channels: 45,328 (158, new 24h)
🗓️ HALVING:
• Days until next halving: 1,192
• Halving date: 2028-04-14 10:02 GMT

DM for feature suggestions, #zaps to support server cost, Share/Boost/Quote to help spread.
Time: 16:22 CET - 10:22 ET - 09:22 CT
v.1.1.11
