New York Tops London As World's Leading Financial Center In 2025
New York Tops London As World's Leading Financial Center In 2025
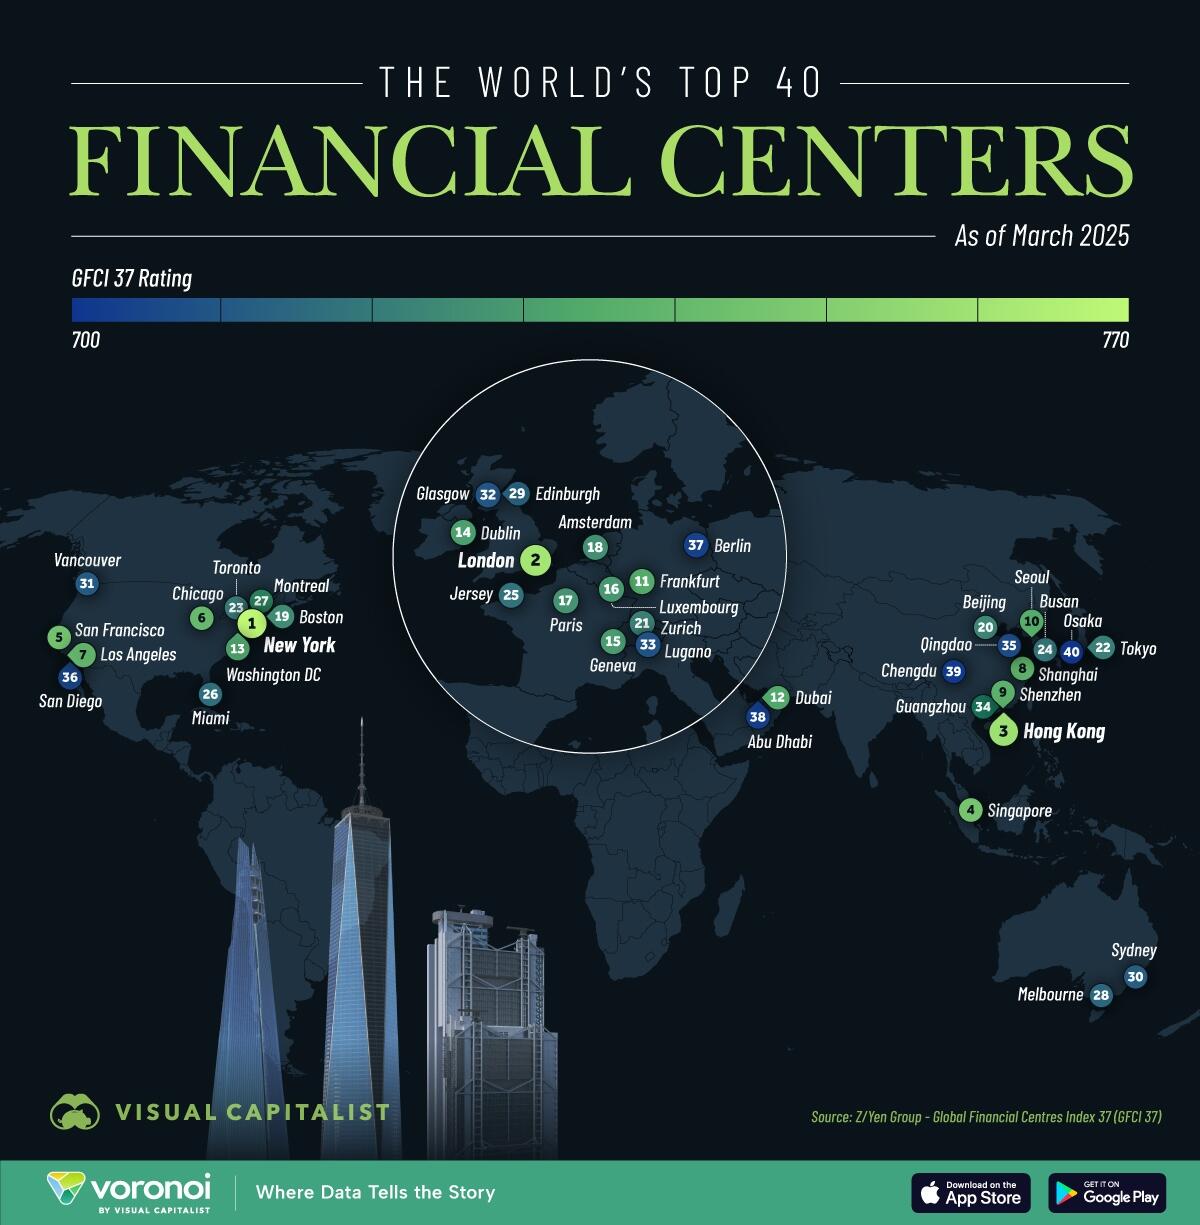
Financial centers are a core pillar of the modern economy, channeling capital, facilitating trade, and driving innovation across the world.
In this graphic, https://www.visualcapitalist.com/mapped-the-worlds-top-financial-centers-in-2025/
.
 ?itok=ET-mGm7q
Data & Methodology
The GFCI 37 was compiled using 140 quantitative measures from sources like the World Bank, OECD, and UN.
These measures are combined with assessments collected by respondents to the GFCI online questionnaire. In total, the GFCI 37 used 31,314 assessments from 4,946 respondents.
The data we used to create this graphic is listed below.
City
GFCI 37 Rank
GFCI 37 Rating
🇺🇸 New York
1
769
🇬🇧 London
2
762
🇭🇰 Hong Kong
3
760
🇸🇬 Singapore
4
750
🇺🇸 San Francisco
5
749
🇺🇸 Chicago
6
746
🇺🇸 Los Angeles
7
745
🇨🇳 Shanghai
8
744
🇨🇳 Shenzhen
9
743
🇰🇷 Seoul
10
742
🇩🇪 Frankfurt
11
741
🇦🇪 Dubai
12
740
🇺🇸 Washington DC
13
739
🇮🇪 Dublin
14
738
🇨🇭 Geneva
15
737
🇱🇺 Luxembourg
16
736
🇫🇷 Paris
17
735
🇳🇱 Amsterdam
18
734
🇺🇸 Boston
19
733
🇨🇳 Beijing
20
732
🇨🇭 Zurich
21
731
🇯🇵 Tokyo
22
730
🇨🇦 Toronto
23
729
🇰🇷 Busan
24
728
🇯🇪 Jersey
25
727
🇺🇸 Miami
26
726
🇨🇦 Montreal
27
725
🇦🇺 Melbourne
28
724
🇬🇧 Edinburgh
29
723
🇦🇺 Sydney
30
722
🇨🇦 Vancouver
31
721
🇬🇧 Glasgow
32
720
🇨🇭 Lugano
33
719
🇨🇳 Guangzhou
34
718
🇨🇳 Qingdao
35
717
🇺🇸 San Diego
36
716
🇩🇪 Berlin
37
715
🇦🇪 Abu Dhabi
38
714
🇨🇳 Chengdu
39
713
🇯🇵 Osaka
40
712
Areas of Competitiveness
The quantitative factors used in the GFCI model are grouped into five areas of competitiveness:
Business environment: Transparency and stability of systems, regulatory complexity
Human capital: Access to skill professionals, investment in education
Infrastructure: Quality of physical and digital infrastructure
Financial sector development: Accessibility to clients, development of digital solutions
Reputation: Trustworthiness of legal and regulatory systems
Regional Insights
We’ve summarized the main highlights from each GFCI region below.
North America
North America has four centers in the top 10: https://www.visualcapitalist.com/us-cities-by-gdp-map/
, San Francisco, Chicago, and Los Angeles. The most improved within North America are Miami and Vancouver, which both climbed over 10 places in the ranking.
Western Europe
London is the region’s dominant center, with seven other cities featuring in the top 20. The average rating across Western Europe increased by 2.14%.
Asia Pacific
Asia Pacific has six centers in the top 20, with four belonging to China (Hong Kong SAR, Shanghai, Shenzhen, Beijing). Looking elsewhere, Hangzhou, New Delhi, Kuala Lumpur, Ho Chi Minh City, and Manila all rose six or more places.
Middle East & Africa
The region’s leading centers are Dubai and Abu Dhabi, with Dubai climbing four places to 12th in GFCI 37. Meanwhile, Tel Aviv, Kuwait City, and Johannesburg each fell more than 10 places.
Latin America & The Caribbean
São Paulo rose seven places this year, making it the leading financial center in the region.
If you enjoyed today’s post, check out https://www.voronoiapp.com/markets/Billion-Dollar-Companies-by-Country-in-2025--4925
on Voronoi, the new app from Visual Capitalist.
https://cms.zerohedge.com/users/tyler-durden
Thu, 05/15/2025 - 20:55
https://www.zerohedge.com/geopolitical/new-york-tops-london-worlds-leading-financial-center-2025