
**The Path To Full Stagflation**
The Path To Full Stagflation
_Authored by Peter Earle via The American Institute for Economic Research,_ (https://www.aier.org/article/the-path-to-full-stagflation/)
In an article last week, I referred to the combination of rapidly slowing US economic growth and persistently high inflation as “stagflation lite (https://www.aier.org/article/stagflation-lite-1st-quarter-us-gdp-growth-weakens-to-1-1-percent-amid-a-renewed-inflationary-surge/).” Despite receding from the highs of last summer, **inflation remains near its highest levels in decades as disinflation (particularly in services) has recently slowed to a crawl.**
Meanwhile, **US economic growth has been on a downward trajectory over the past few years**, including a brief recession in the middle two quarters of 2022.
 ?itok=VT3KUj5Y (
 ?itok=VT3KUj5Y)
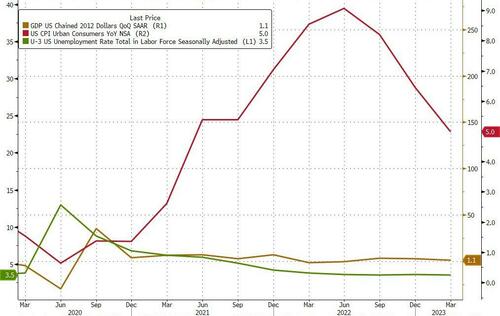
**What’s currently missing from the full stagflationary scenario is elevated unemployment.** The Bureau of Labor Statistics reported the U-3 US unemployment rate (https://fred.stlouisfed.org/series/UNRATE) as 3.5 percent in March 2023, which is near historic lows. Indeed, low employment has been a thorn in Fed officials’ side since they began hiking short-term rates in March of 2022. The below chart depicts the current, stagflation lite conditions: high inflation (March 2023 year-over-year headline CPI at roughly 5 percent), declining economic growth (1st quarter 2023 US GDP at 1.1 percent), and U-3 employment at 3.5 percent.
 ?itok=a9MA7f_Y (
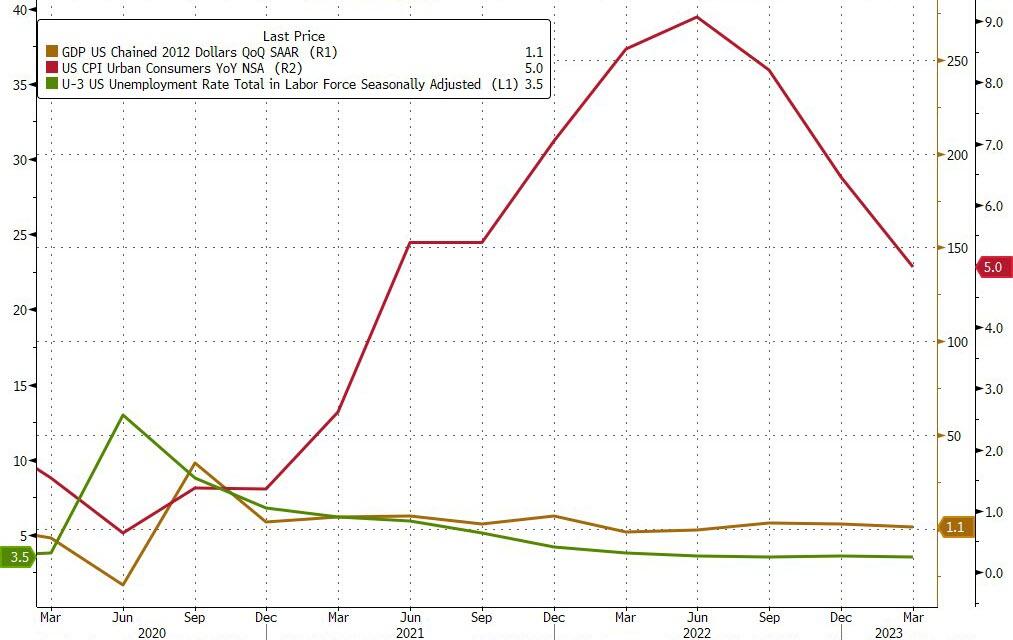 ?itok=a9MA7f_Y)
_(Source: Bloomberg Finance, LP)_
Could a full stagflationary episode evolve from this? It’s possible that one already is, according to two sources of data.
First, a look at unemployment data on a state-by-state basis. Tracking the 4-week, year-over-year percentage changes in initial filings for unemployment, 24 of 51 states (50 states plus Washington DC) are showing an average 10-percent or greater increase in those filings over the period from mid-March 2023 to mid-April 2023.
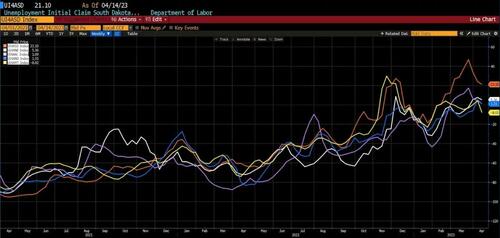
The ten US states with the lowest unemployment rates (https://www.bls.gov/web/laus/laumstrk.htm), as of mid-April 2023, include the following: South Dakota (1.9 percent), Nebraska (2.1 percent), North Dakota (2.1 percent), Alabama (2.3 percent), Montana (2.3 percent), New Hampshire (2.4 percent), Utah (2.4 percent), Missouri (2.5 percent), Wisconsin (2.5 percent), and Florida (2.6) percent. Below are the recent trends in initial unemployment filings in those low-unemployment-rate states.
**Initial Unemployment Claims in High Employment States: South Dakota, Nebraska, Alabama, North Dakota, and Montana (April 2021 – April 2023)**
 ?itok=MmahS5Us (
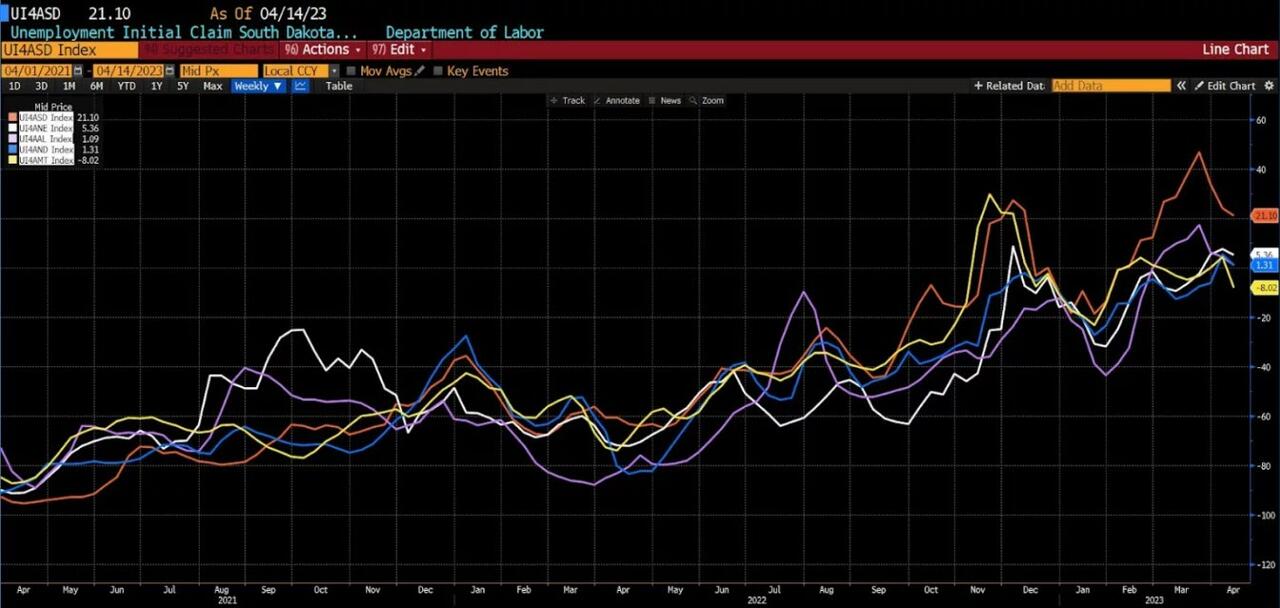 ?itok=MmahS5Us)
_(Source: Bloomberg Finance, LP)_
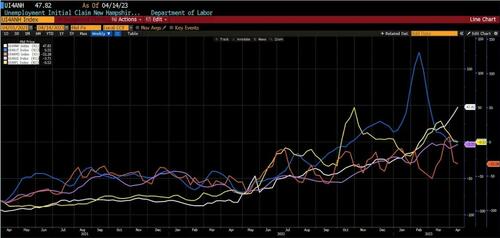
**Initial Unemployment Claims in High Employment States: New Hampshire Utah, Missouri, Wisconsin, and Florida (April 2021 – April 2023)**
 ?itok=Y5s_Wzt0 (
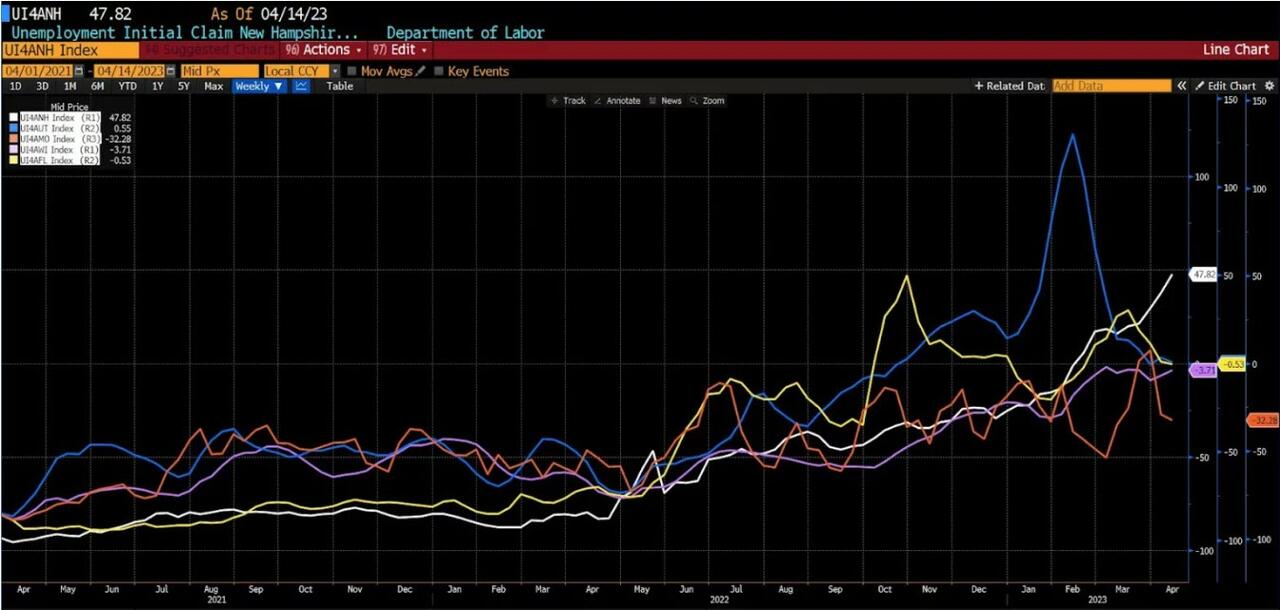 ?itok=Y5s_Wzt0)
_(Source: Bloomberg Finance, LP)_
The ten US states with the highest unemployment rates (https://www.bls.gov/web/laus/laumstrk.htmhttps://www.bls.gov/web/laus/laumstrk.htm) (again, as of mid-April 2023) include: Michigan (4.1 percent), New York (4.1 percent), Pennsylvania (4.2 percent), California (4.4 percent), Delaware (4.4 percent), Illinois (4.4 percent), Washington (4.5 percent), District of Columbia (4.8 percent), and Nevada (5.5 percent). Below are the trends in initial unemployment claims in the highest unemployment states.
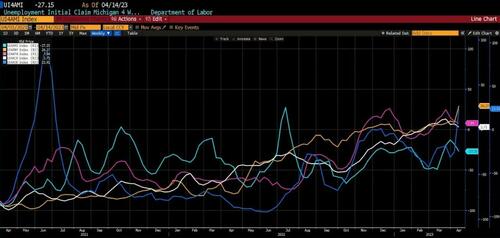
**Initial Unemployment Claims in Low Employment States: Michigan, New York, Pennsylvania, California, and Delaware (April 2021 – April 2023)**
 ?itok=knXUdS_w (
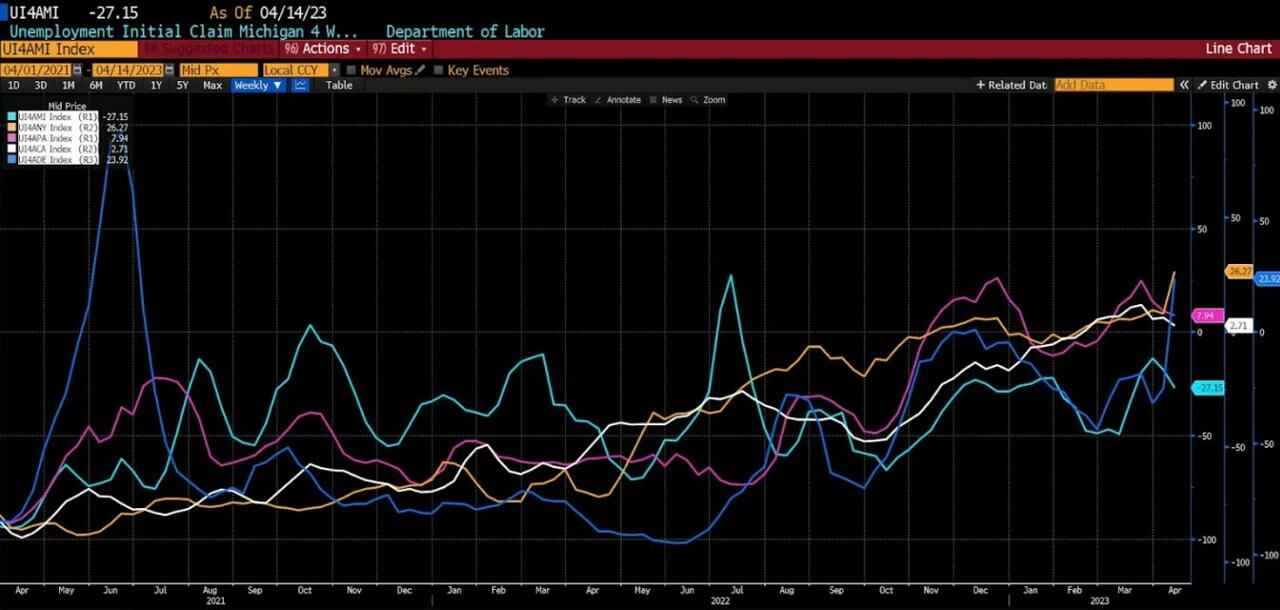 ?itok=knXUdS_w)
_(Source: Bloomberg Finance, LP)_
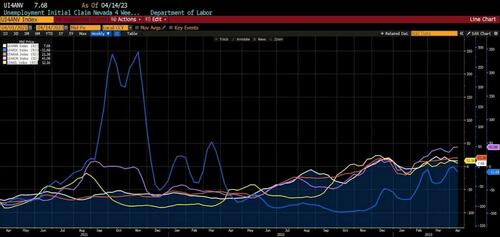
**Initial Unemployment Claims in Low Employment States: Oregon, Illinois, Washington, District of Columbia, and Nevada (April 2021 – April 2023)**
 ?itok=5gX9iAiK (
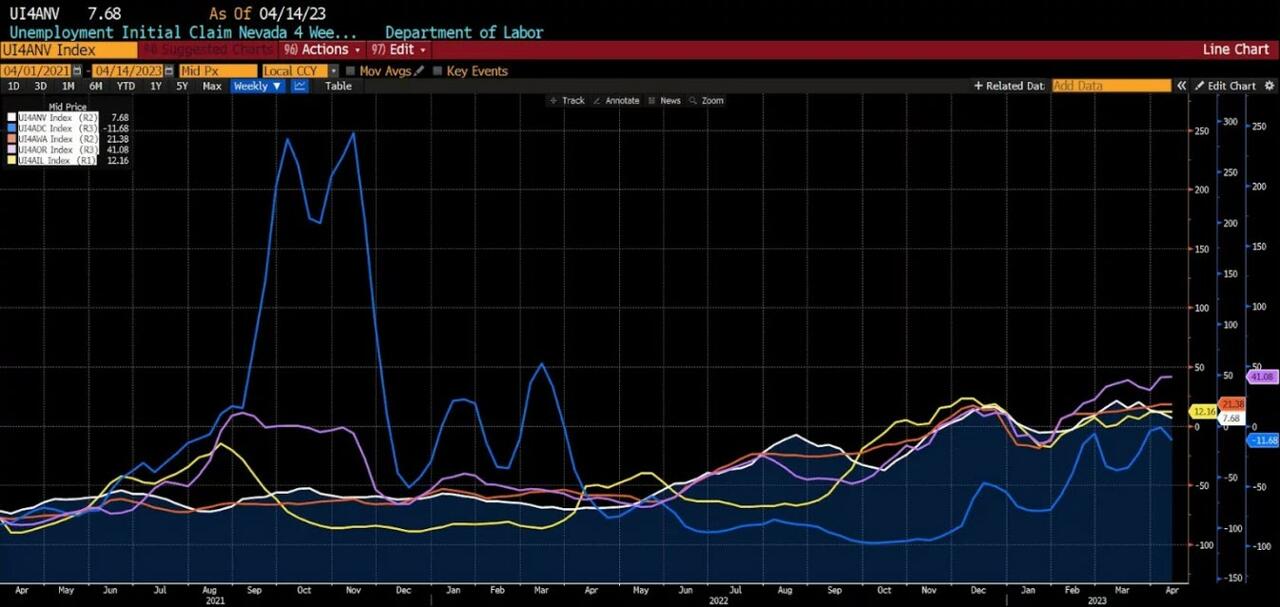 ?itok=5gX9iAiK)
_(Source: Bloomberg Finance, LP)_
In most of the ten US states with the lo…