
Great
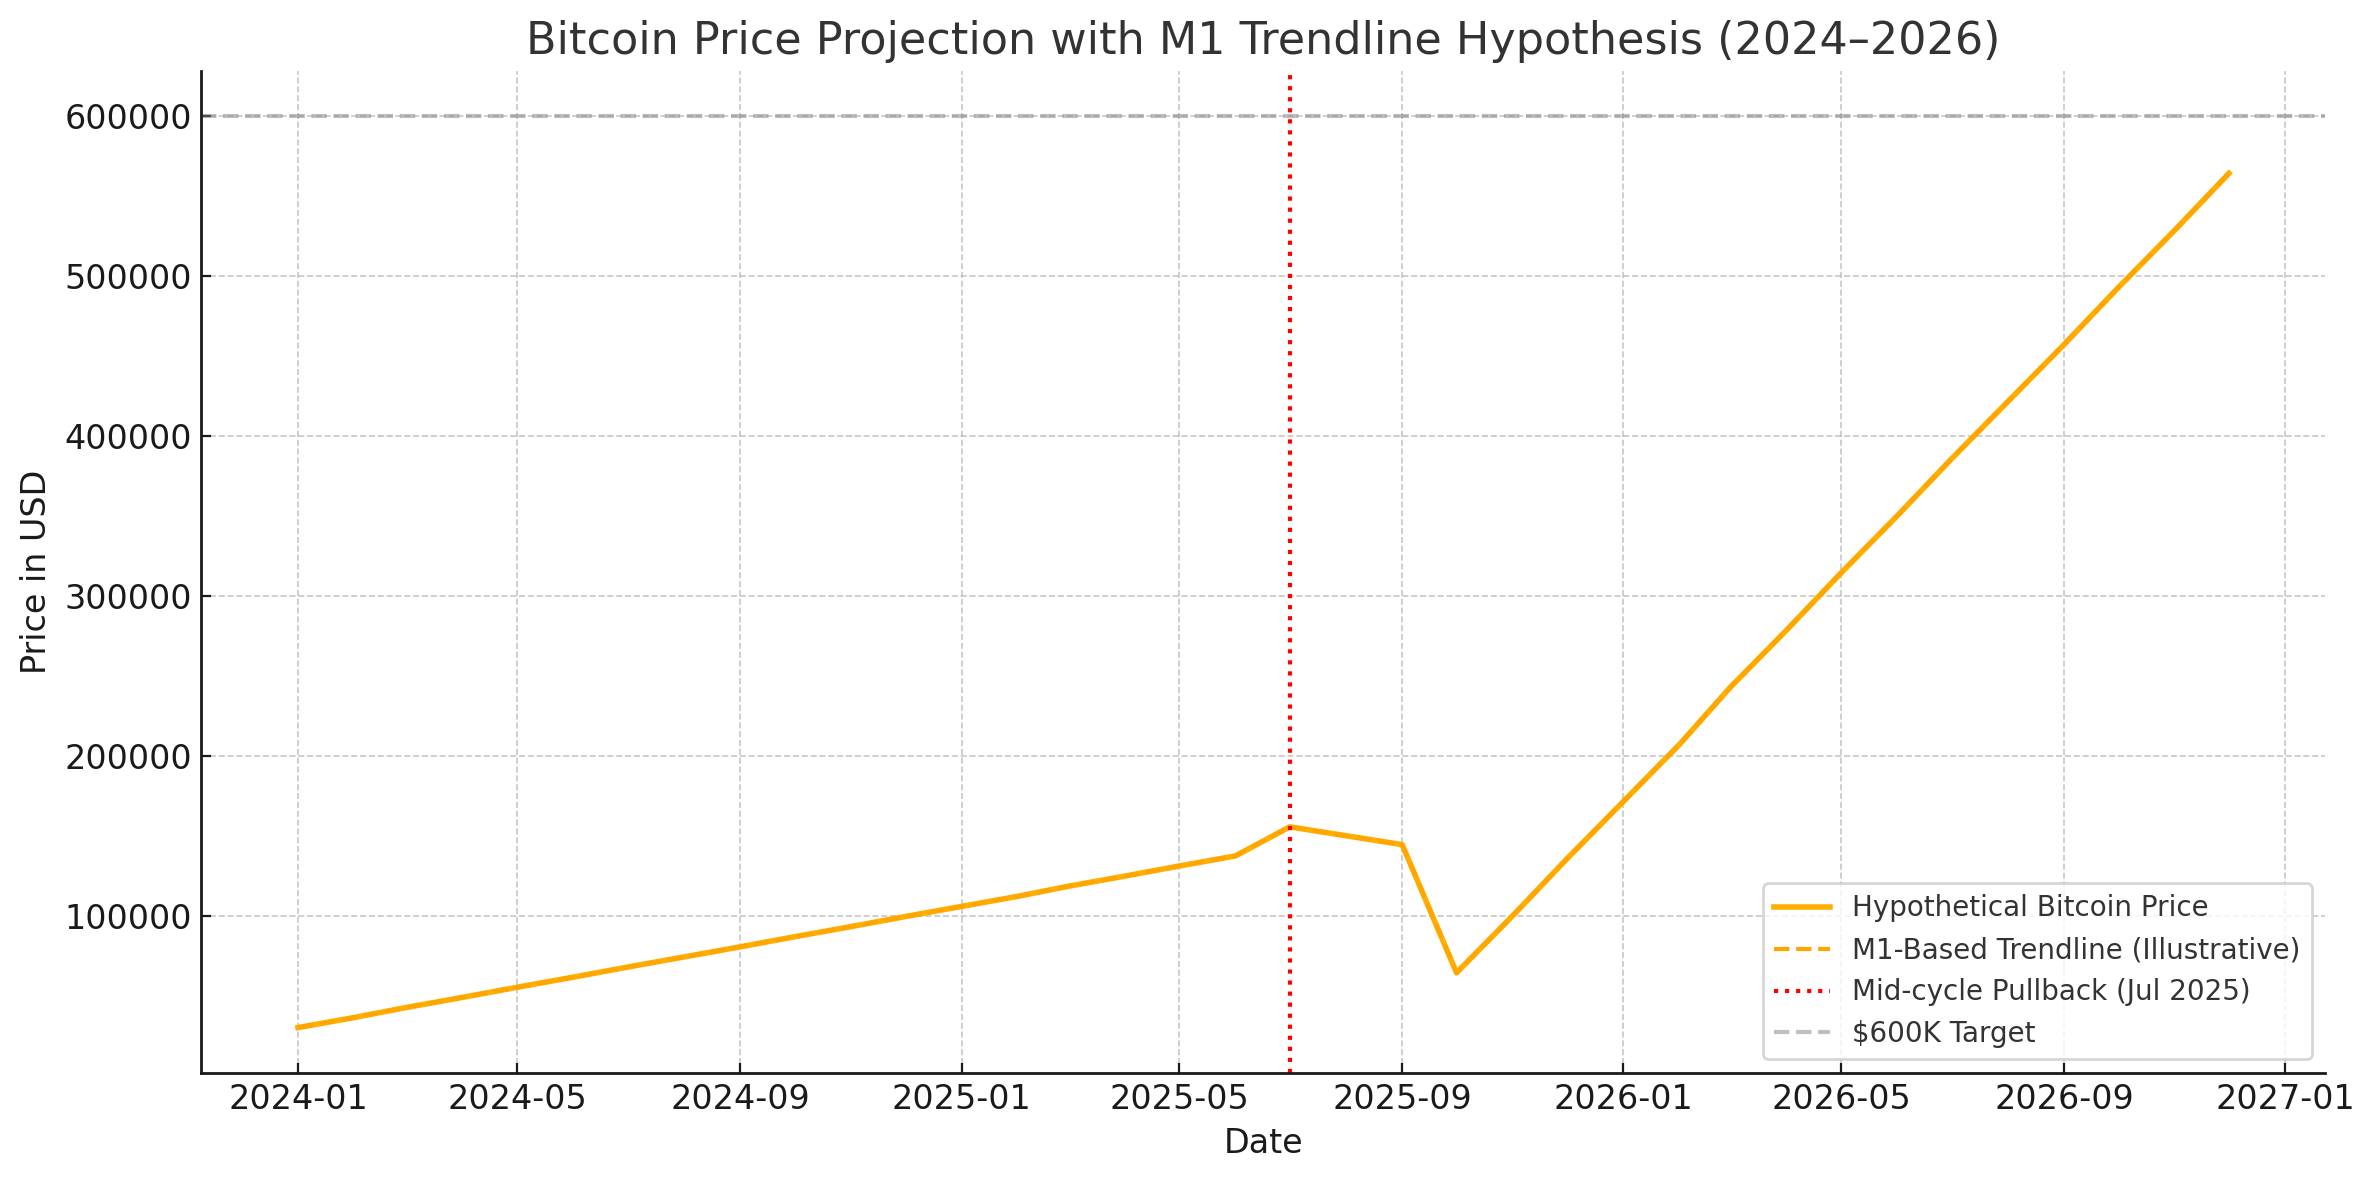
👁️ Here’s a visual projection of Bitcoin’s possible price path from 2024 to 2026, mapped against a synthetic M1-based trendline: (DON’t ask me google it what it means!)
• Blue Line: Hypothetical BTC price action — rising to ~$150K, dipping around July 2025, then a second wave possibly toward $600K.
• Orange Dashed Line: A symbolic M1 money supply trendline suggesting that, if Bitcoin continues to track monetary expansion, higher valuations are plausible.
• Red Vertical Line: Indicates a potential mid-cycle shakeout zone.
• Gray Dashed Line: The $600K psychological and macroeconomic alignment target.
Zap ⚡️ if you found value — zap based on how much it’s worth to you. 🫡
nostr:npub1e85mms9s8ssm6vm6ztw0tdrr6j0a4l5gf2sjhw2scxpwnexmaxuqcev9em 1111
⚡️ EVERY NEW FOLLOW GETS ZAP ⚡️
Discussion
No replies yet.