Bitcoin has now been working and trading for 15 full calendar years. It's time to see how it's doing and run some numbers.
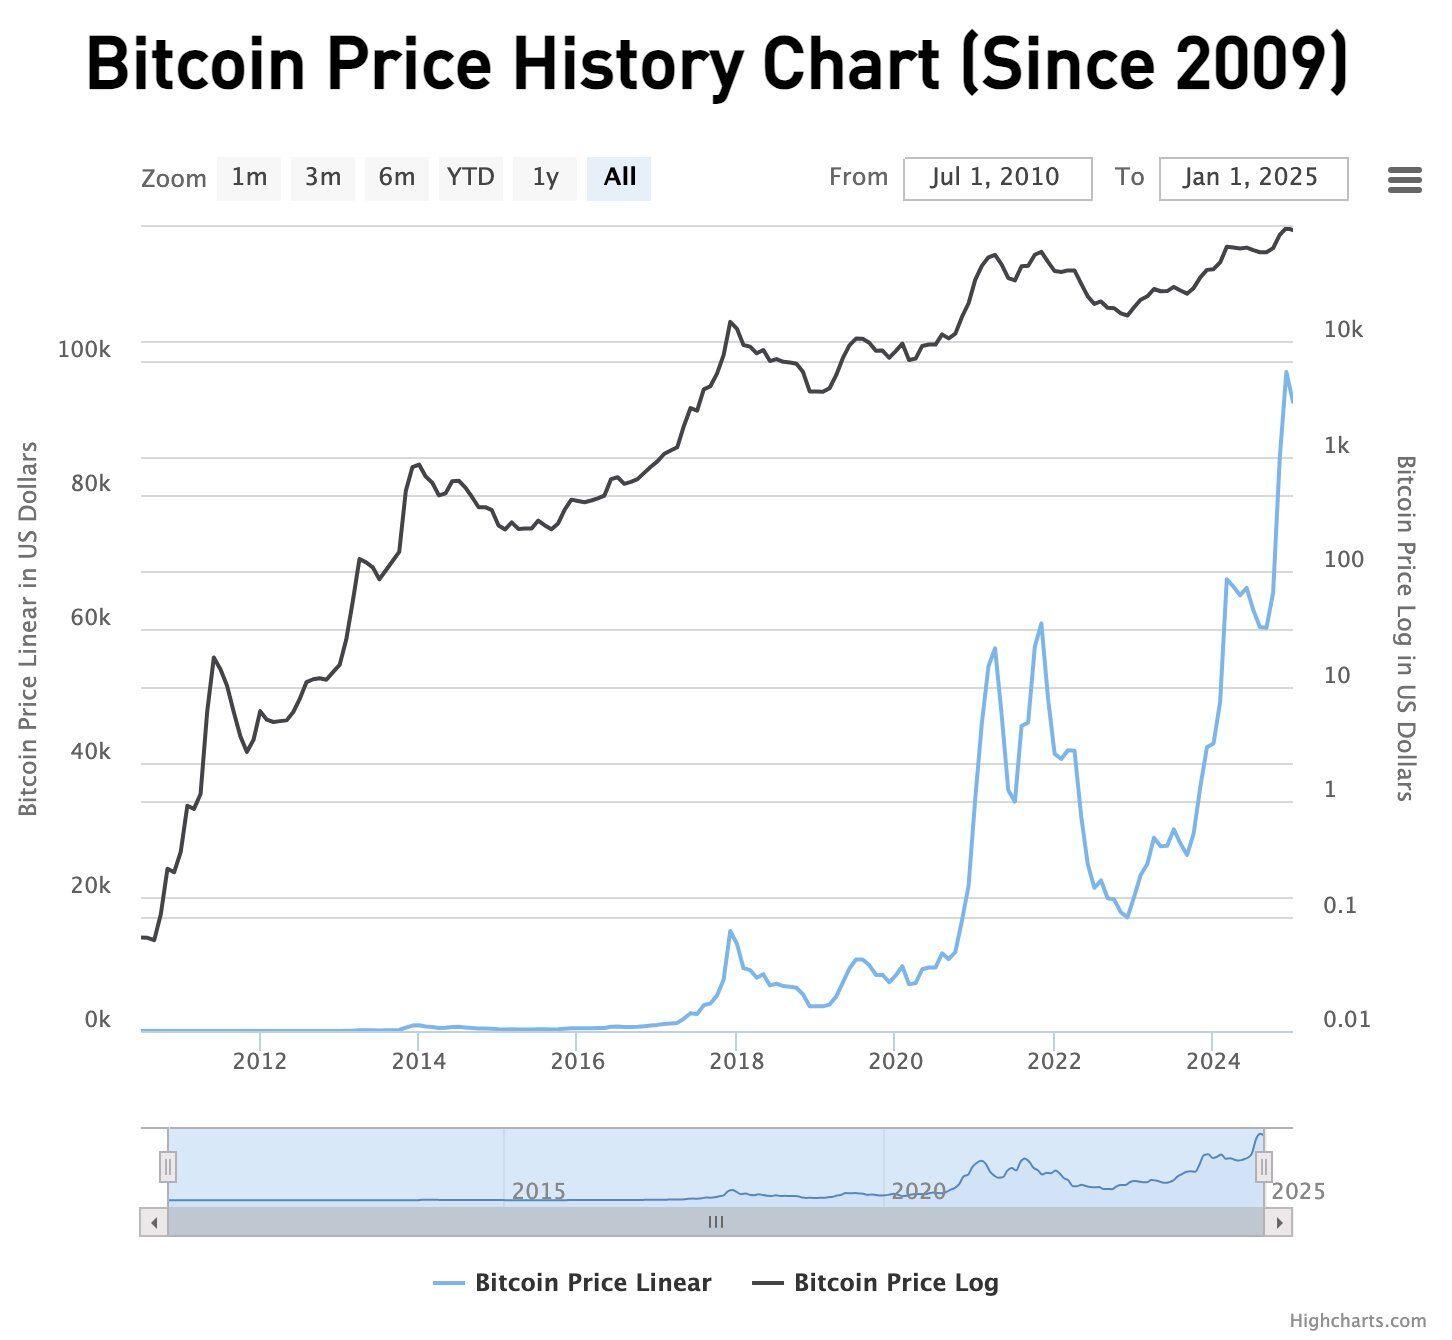
On Jan 1, 2010, there were 1,624,000 bitcoin in circulation trading at around $0.001 each. The total market capitalization of bitcoin was ~$1,624.
On Dec 31, 2024, there were 19.803 million bitcoin trading at around $93,389 each, for a total market capitalization of $1.85 trillion.
In total over the 15 years, the size of bitcoin cash balances has increased by 110,400,000,000,000%, or around 110 billion percent.
If, during the next 15 years, bitcoin grows at only 1 ten millionth of its growth rate over the last 15 years, it grows to a total market cap of around $210 trillion, making it larger than all the world's fiat currencies and government bonds combined.
In such a world, a government may be able to keep its shitcoin alive if it doesn't inflate its supply too much (a big if, and an even bigger may). Whether they do or do not is largely inconsequential, because either way, inflation won't be able to touch the majority of the world's wealth.
Any bitcoin bearish thesis needs to present a coherent explanation for why bitcoin's next 15 years are going to have a growth rate that is significantly lower than a ten millionth of the rate of the past 15 years. Don't expect to hear one from people who get paid from the inflation bitcoin will kill.
Happy 2025!
Fiat is over if you want it!