
**Visualizing Air Pollution Levels Around The World In 2022**
Visualizing Air Pollution Levels Around The World In 2022
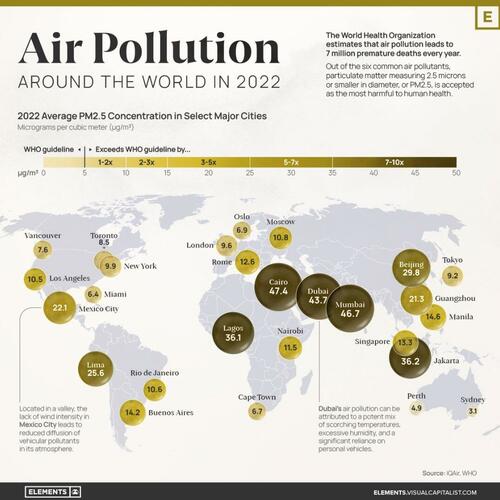
The World Health Organization (WHO) estimates that **air pollution** leads to **7 million (https://www.who.int/india/health-topics/air-pollution) premature deaths every year.**
Out of the six common air pollutants, particulate matter measuring 2.5 microns or smaller in diameter, or **PM2.5**, is accepted as the most harmful to human health. This is due to its prevalence in the atmosphere and the broad range of adverse health effects associated with its exposure, such as heart disease, stroke, lung cancer and chronic respiratory diseases.
With that context in mind, this visualization from Visual Capitalist's Selin Oğuz and Miranda Smith (https://www.visualcapitalist.com/mapped-air-pollution-levels-around-the-world-2022/) uses IQAir’s World Air Quality Report (https://www.iqair.com/ca/world-air-quality-report) to map out the 2022 average PM2.5 concentrations in select major cities around the globe, expressed in micrograms per cubic meter (μg/m³).
 ?itok=k-d2-x9S (
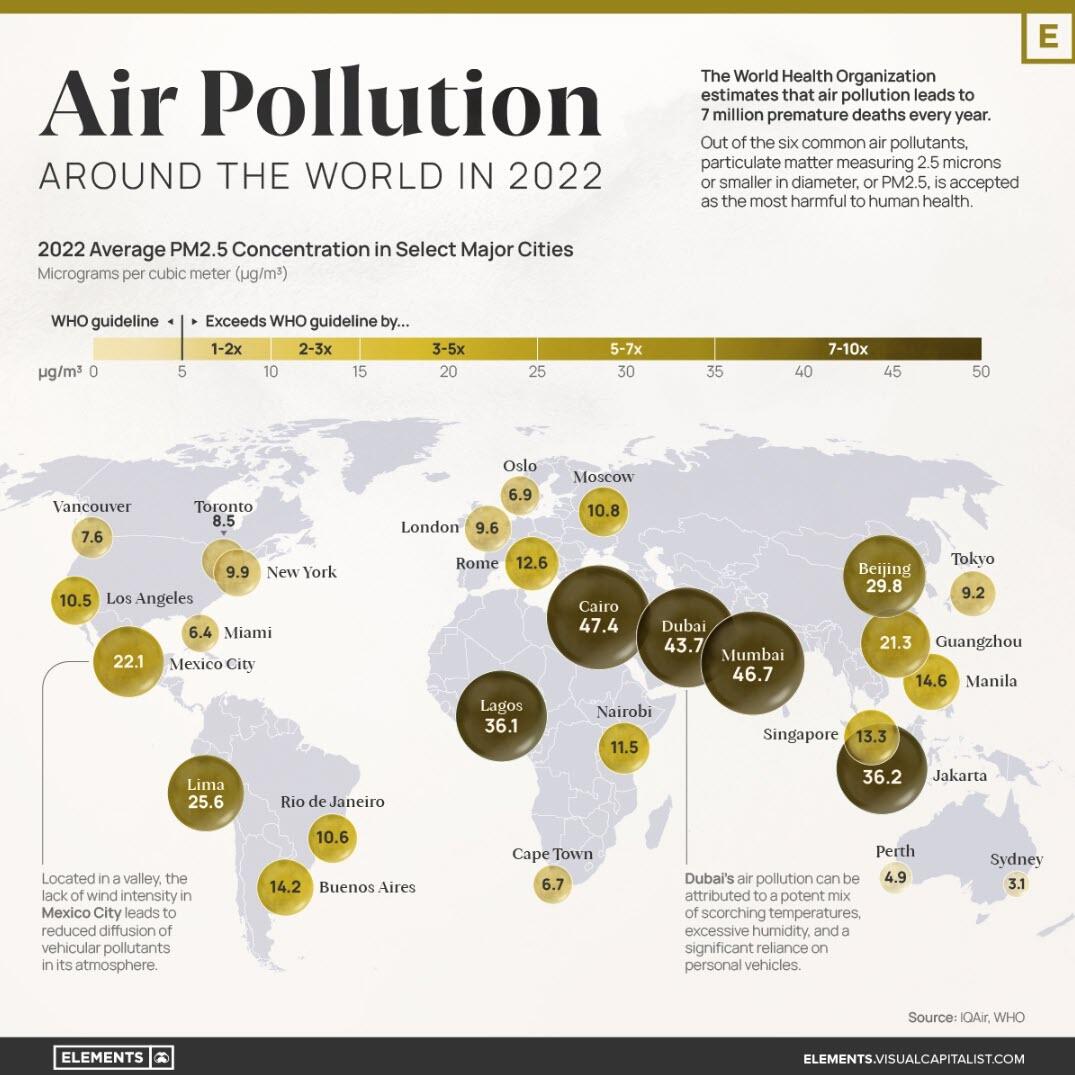 ?itok=k-d2-x9S)
Understanding the WHO Air Pollution Guidelines
Did you know that in 2019, only 1% of the global population (https://www.who.int/news-room/fact-sheets/detail/ambient-(outdoor)-air-quality-and-health) lived in places where WHO global air quality guidelines were met?
Designed to protect public health from the harmful effects of air pollution, the guidelines (https://apps.who.int/iris/bitstream/handle/10665/345329/9789240034228-eng.pdf) cover a range of air pollutants, including particulate matter, ozone, nitrogen dioxide, sulfur dioxide, and carbon monoxide.
The healthy limits for PM2.5 are set at an annual average of **0-5 μg/m³**.
WHO ClassificationAnnual Average PM2.5 Concentration (μg/m³)% of countries within classification, 2022\*WHO Air Quality Guideline0 - 59.9%Interim Target 45.1 - 1018.3%Interim Target 310.1 - 1519.8%Interim Target 215.1 - 2528.2%Interim Target 125.1 - 359.9%Exceeds Target Levels35.1 - 507.6%Exceeds Target Levels\> 506.1%
\* _Percentages are calculated as a proportion of the 131 countries that had sufficient air quality data and were included in IQAir’s World Air Quality Report in 2022._
According to IQAir’s World Air Quality Report, only **13 countries or territories** met the recommended concentration of PM2.5 in 2022. Among them were Australia, Finland, Puerto Rico, Iceland, Bermuda, and Guam.
Above this guideline, many countries fell within the four interim targets, while nearly **14%** recorded air pollution levels that exceeded all target levels.
The Effects of Air Quality on Mortality
While it can be a little difficult to grasp what the above concentrations represent, thinking of them in terms of their effect on mortality can shed some light on their significance.
According to the WHO (https://apps.who.int/iris/bitstream/handle/10665/345329/9789240034228-eng.pdf), non-accidental mortality rates multiply by **1.08 per 10 µg/m³ increase** in PM2.5 concentration, but only up to 35 μg/m³. Above that, mortality growth rates may not be linear, resulting in many more deaths.
Here is an example to highlight what that means.
- Say that, for a population living within the WHO PM2.5 guideline, the non-accidental mortality rate is arbitrarily set to **100 deaths** for a given period.
- If this area’s PM2.5 concentration goes up to 10 μg/m³, putting them at **Interim Target 4**, they would see **104 deaths** in that same amount of time.
- At **Interim Target 3**, where their PM2.5 concentration would be 15 μg/m³, they would see **108 deaths**.
- At **Interim Target 2**, they’d see **117**.
- Finally, at **Interim Target 1**, they’d see **126**.
Beyond Interim Target 1 (above 35 μg/m³), deaths would potentially grow **much faster**. As of 2022, around 14% of countries report levels above this threshold, including Chad, India, Pakistan, Qatar, and Nigeria.
The State of Air Pollution Around the World
While many cities in North America and Europe have seen steady and relatively lower PM2.5 concentrations during the last few years, many cities (especially those in Asia) have been making strides in lowering their air pollution levels.
Nonetheless, many of them still record PM2.5 concentrations that are more than **six times** the WHO guideline.
City2022 annual average PM2.5 concentration (μg/m³)2018 annual average PM2.5 concentration (μg/m³)🇪🇬 Cairo, Egypt47.4N/A🇮🇳 Mumbai, India46.758.6🇦🇪 Dubai, UAE43.755.3🇮🇩 Jakarta, Indonesia36.245.3🇳🇬 Lagos, Nigeria36.1N/A🇨🇳 Beijing, China29.850.9🇵🇪 Lima, Peru25.628🇲🇽 Mexico City, Mexico22.119.7🇨🇳 Guangzhou, China21.333.2🇵🇭 Manila, Philippin…
https://www.zerohedge.com/weather/visualizing-air-pollution-levels-around-world-2022