
Discussion

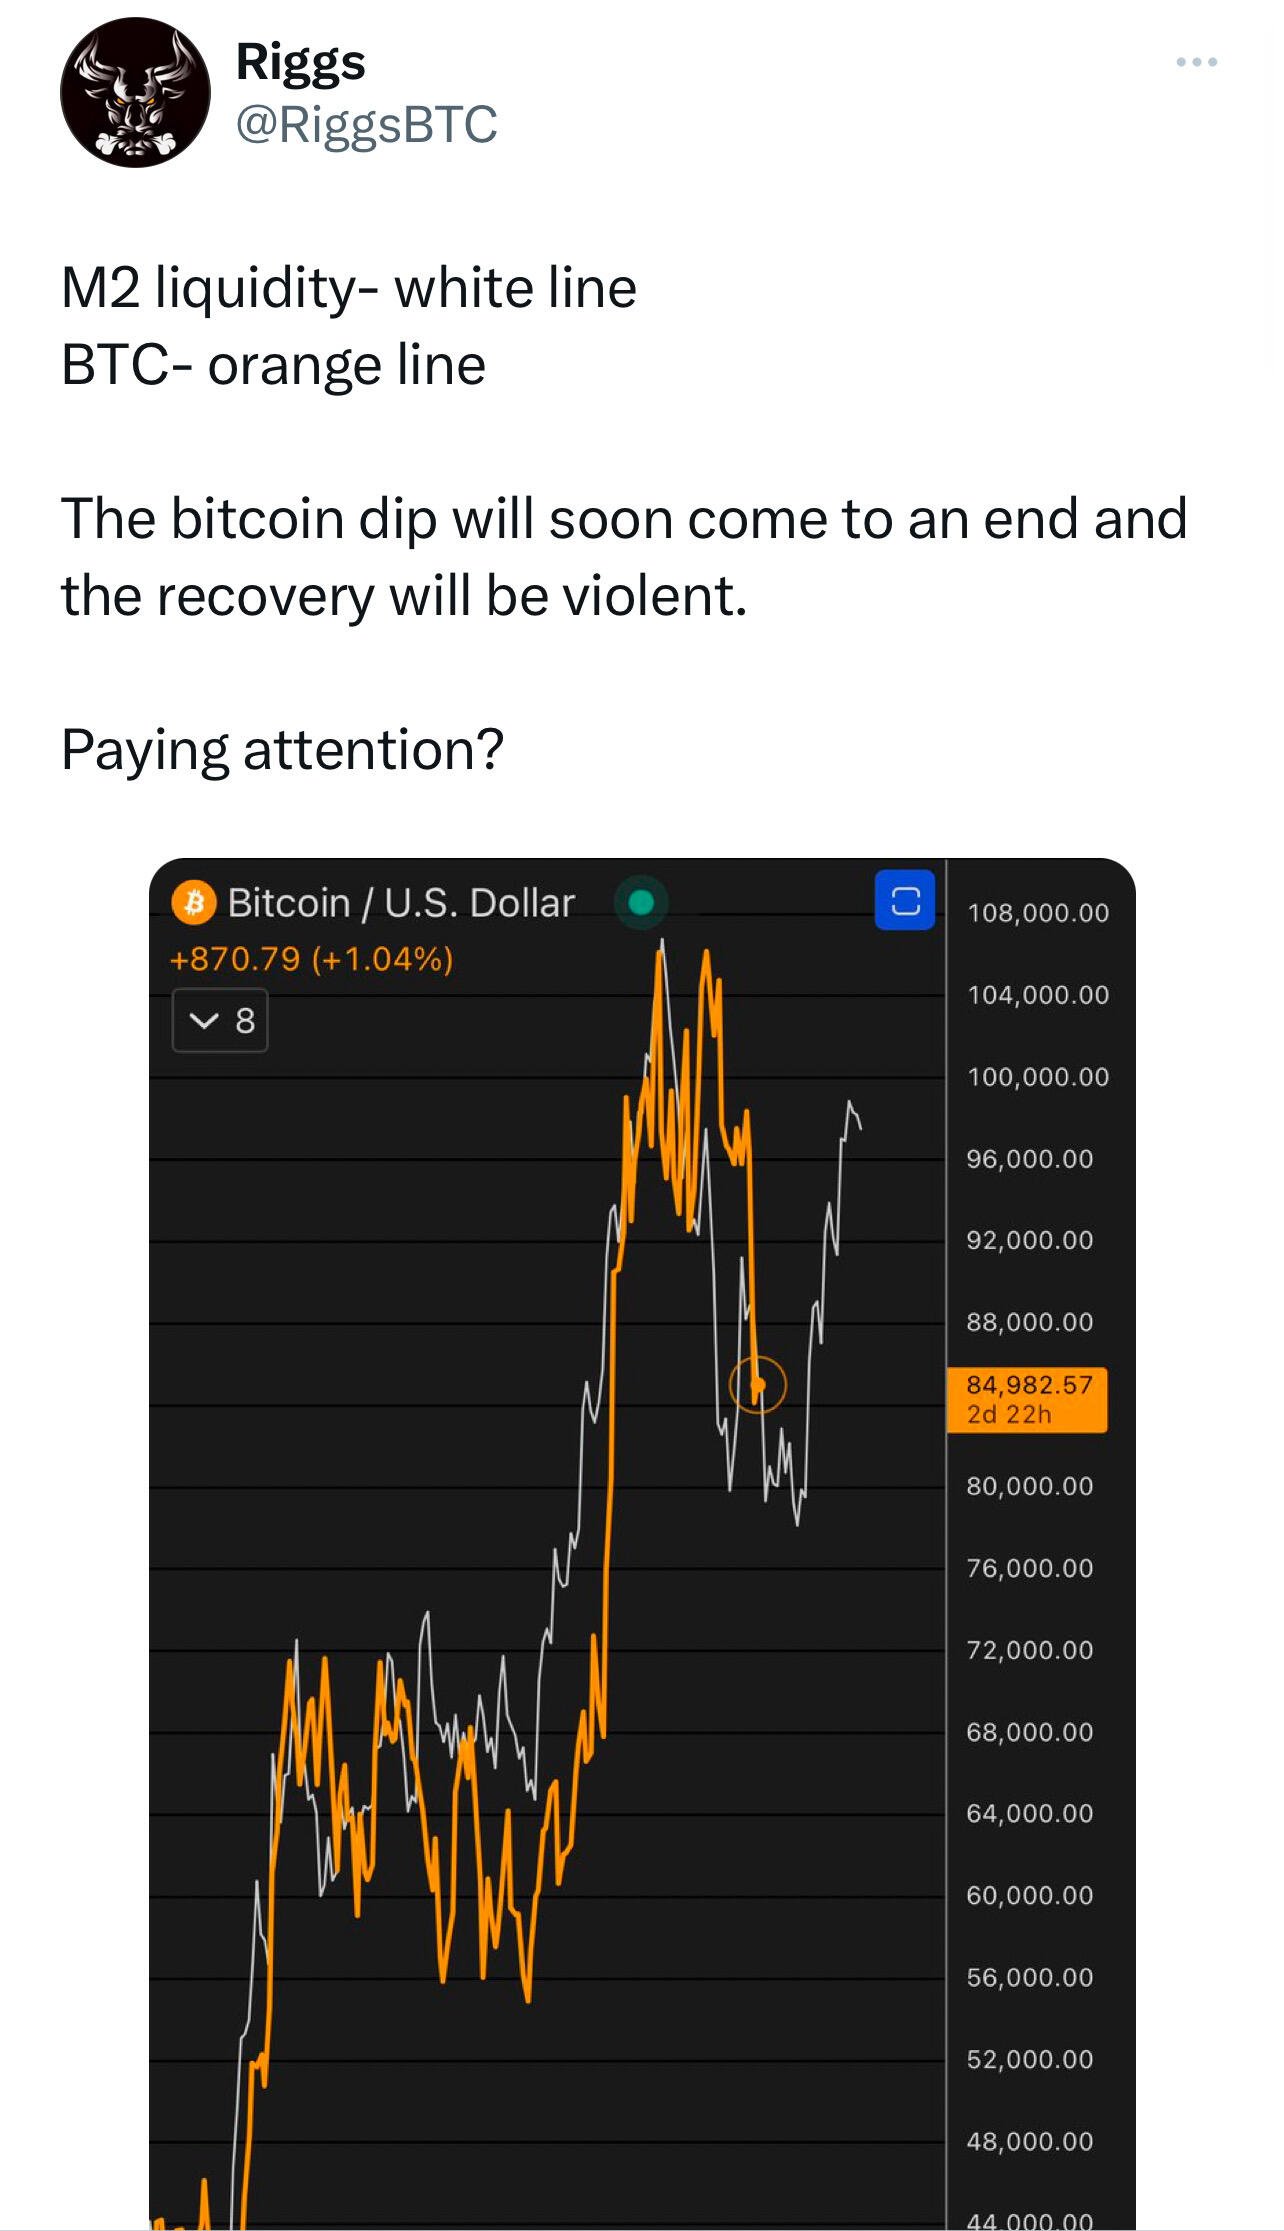
I keep seeing this. I assume the x axis is time and the y axis is price and m2 money printing. Why is Bitcoin lagging in time? Or is the M2 assuming the future?

I think this is showing that the bitcoin price lags M2 by a few months, so the white line has been shifed to right. The x-axis is time and the two y-axes are BTC price and M2 Liquidity.

True