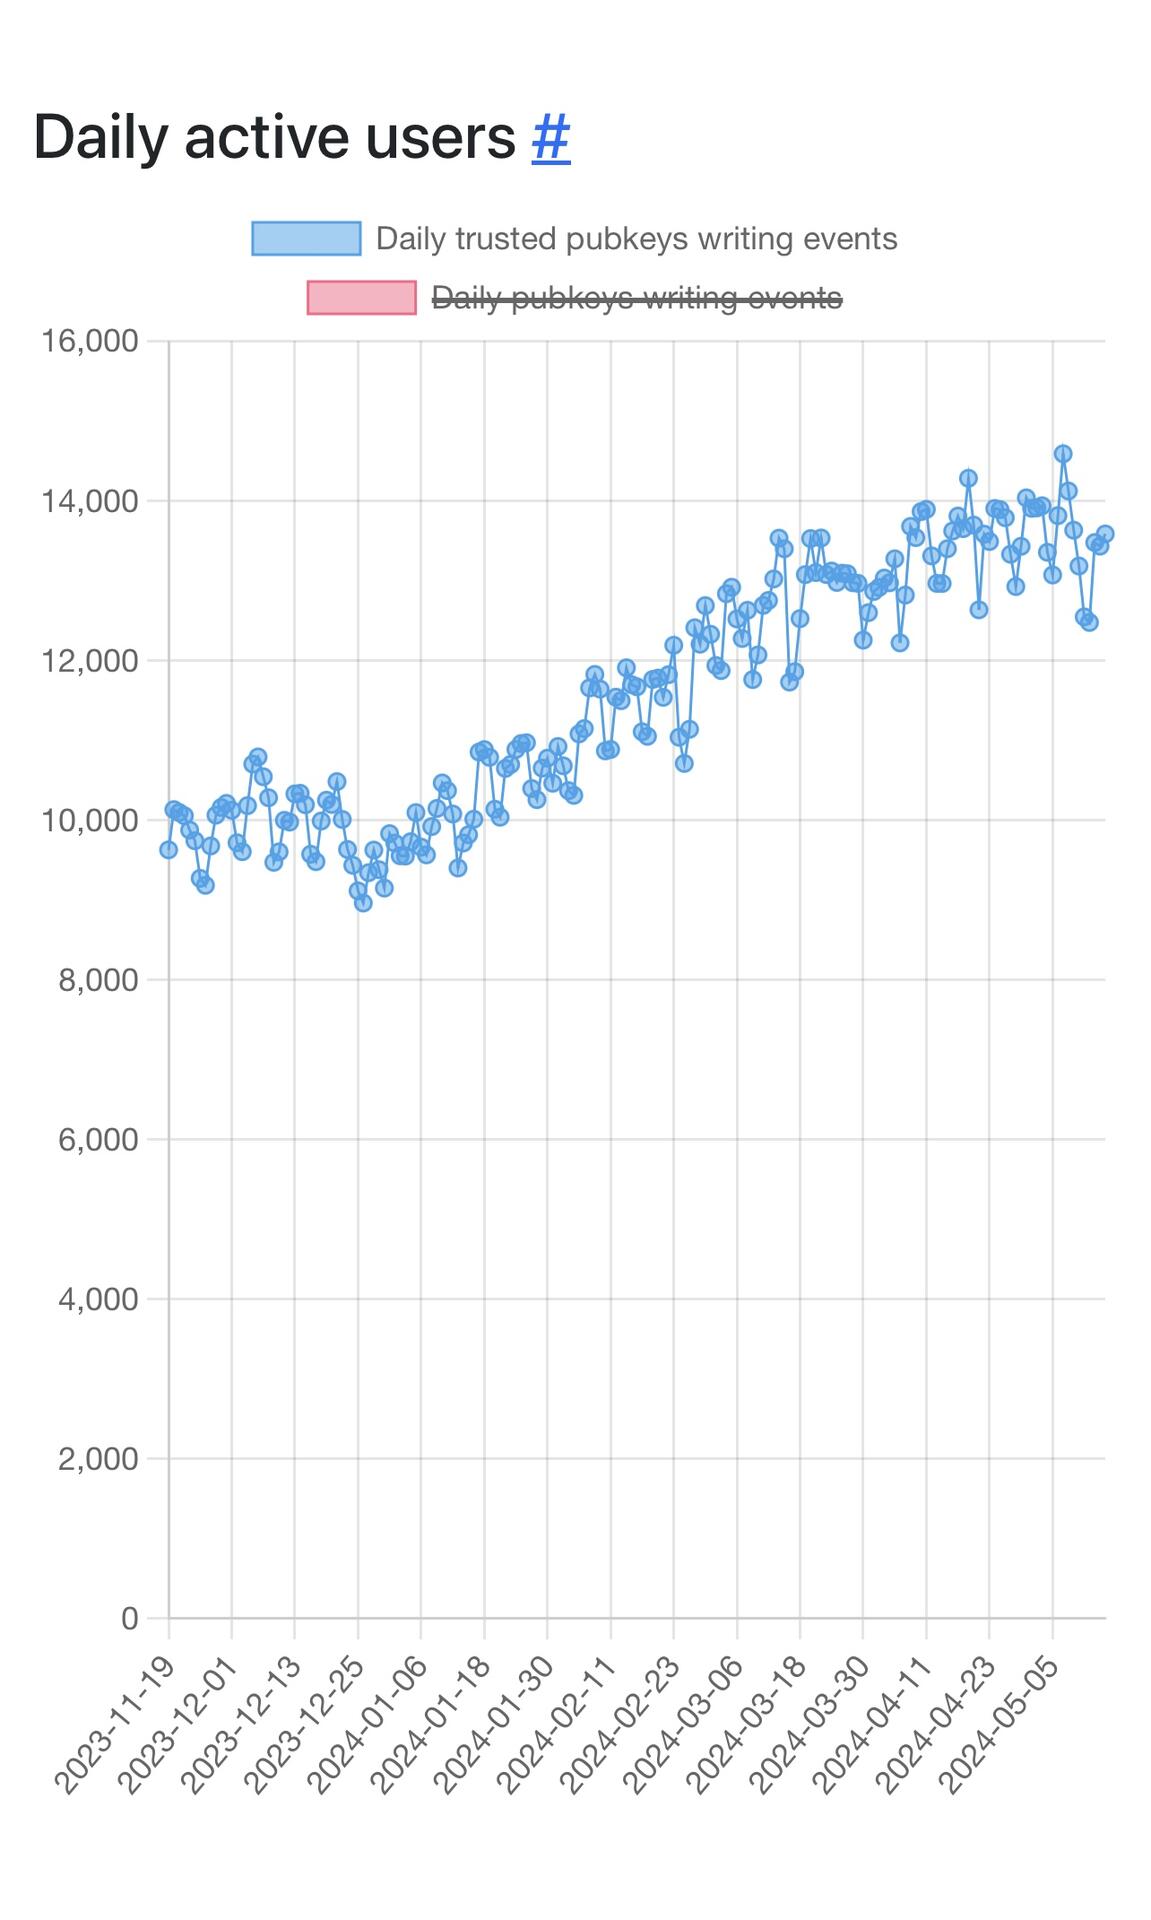
nostr:npub1xdtducdnjerex88gkg2qk2atsdlqsyxqaag4h05jmcpyspqt30wscmntxy Any way the graphing can be done to avoid showing that drop on the latest point, since it’s not the best visualization of the data?
nostr:npub1xdtducdnjerex88gkg2qk2atsdlqsyxqaag4h05jmcpyspqt30wscmntxy Any way the graphing can be done to avoid showing that drop on the latest point, since it’s not the best visualization of the data?