
Still holding in? I actually revisited this because I didn't like that the power trend line for all weekly BTC price breaks below the S2F model long term. Basically I started say well how bad will it break do I have to keep readjusting? That's a big fault. Read more about people saying that because I didn't use strictly price and I used market cap and divided out stock to get price I was getting r2 higher than I should. Bunch of shit.
I came up with something even better that fixes those problems arguments and gets a r2= 975.
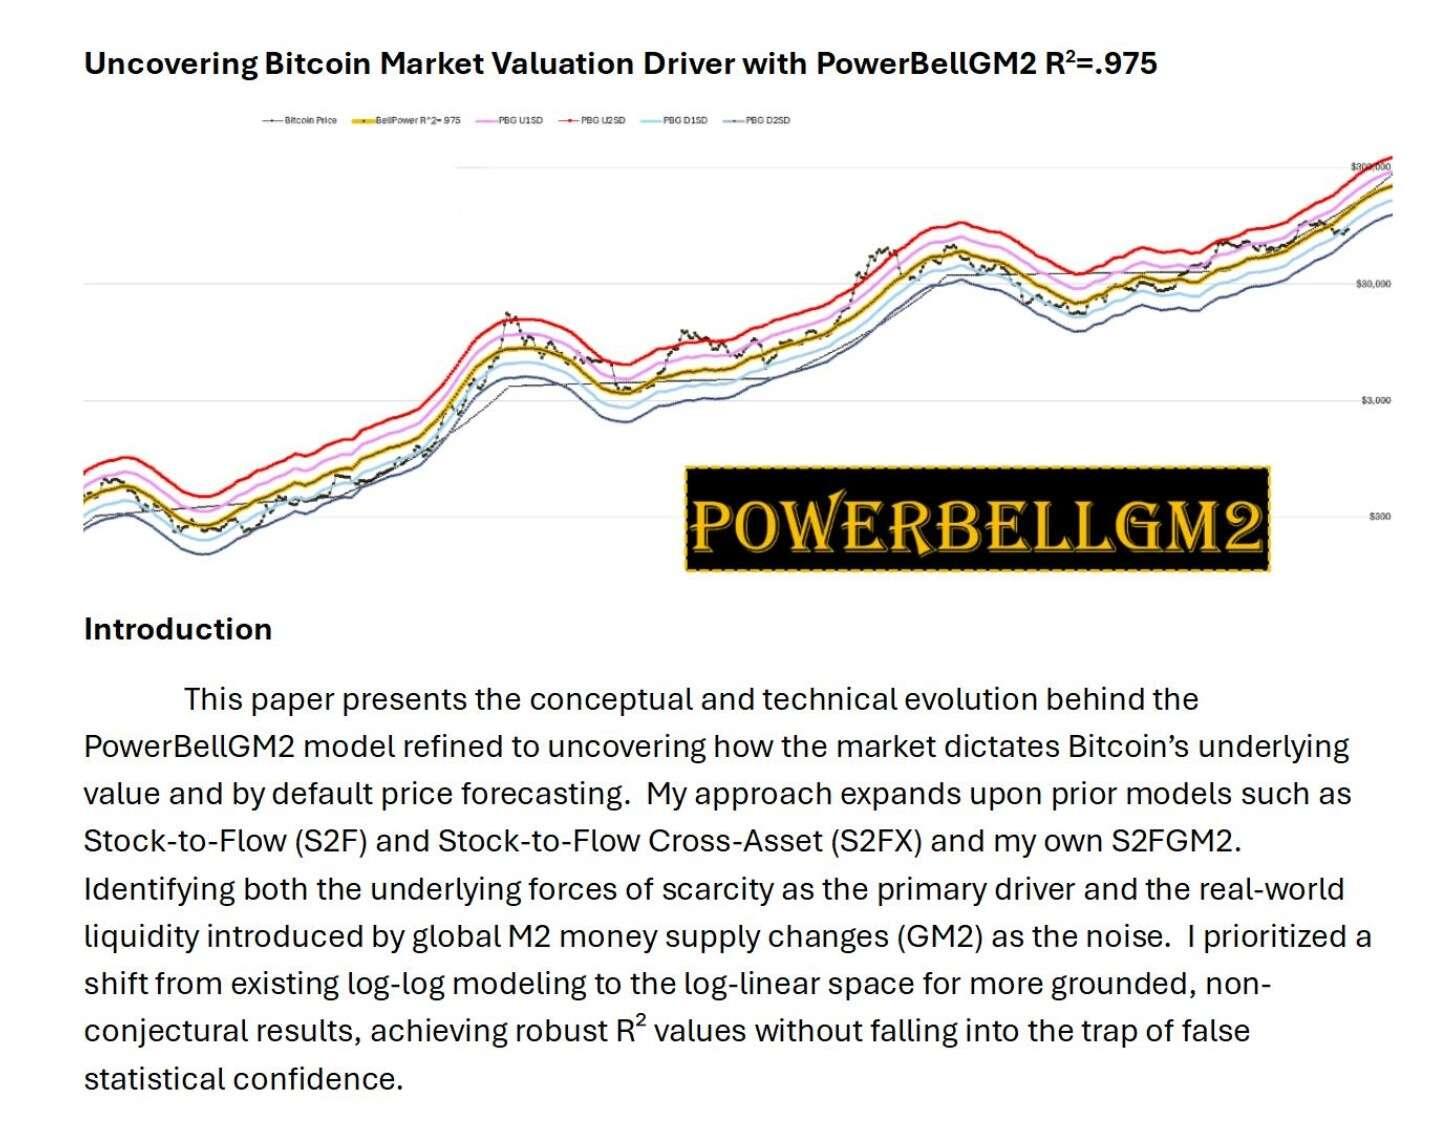
Using weekly price. Most granular chart ever also its log standard time unlike planb log log. Uses what i learned from s2fgm2. I actually wrote a white paper that 3xplaines everything.
I think it is fucking genius. But I'm partial. Look at this shit! It doesn't break.

