8/ However, if you want to understand the long-term trends of money printing, you need to measure the all-time growth of each currency's stock.
That chart is here. See how no money has 'negative growth' under this lens.
Due to compounding, it's about 1% per month, worldwide... 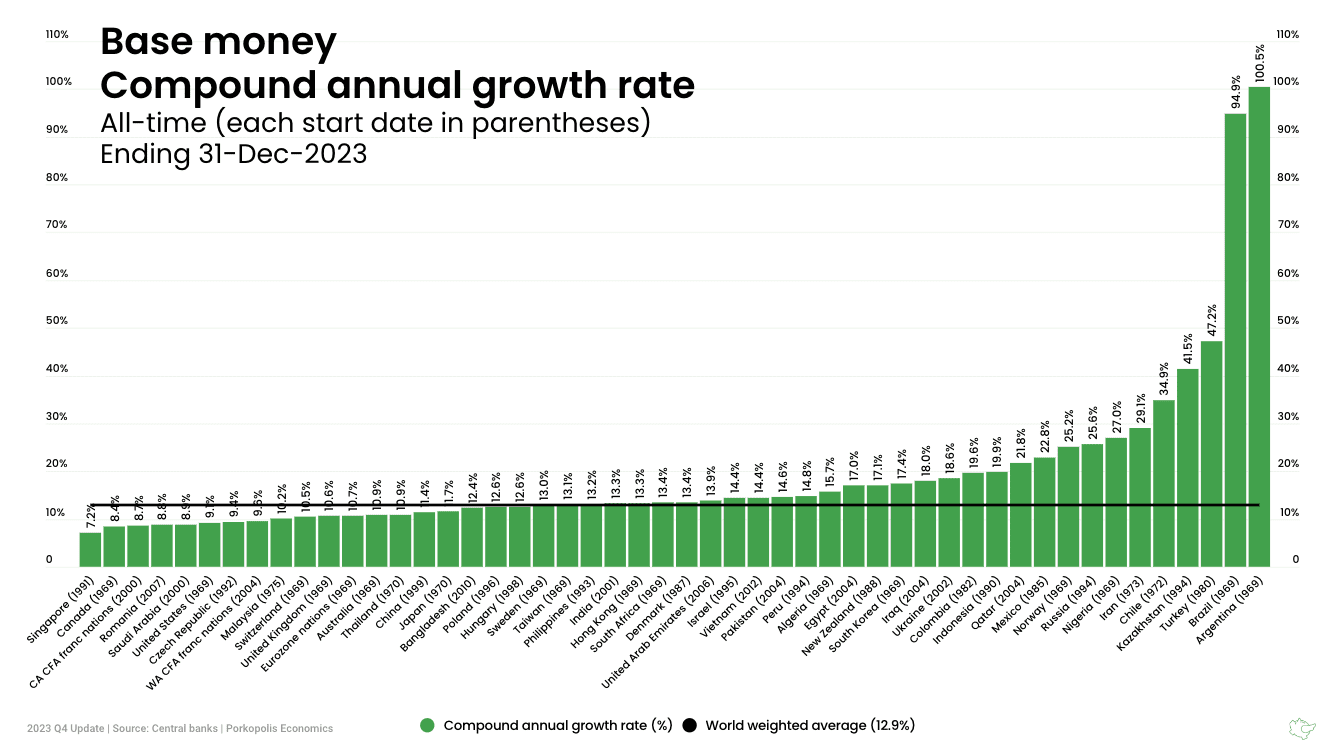
9/ Now let's back up and take a look at the top ten fiats, but layer in gold & silver (base money of the past), and #Bitcoin (base money of the future).
This is the whole enchilada. This is 🤜all the settlement money🤛 in the world. 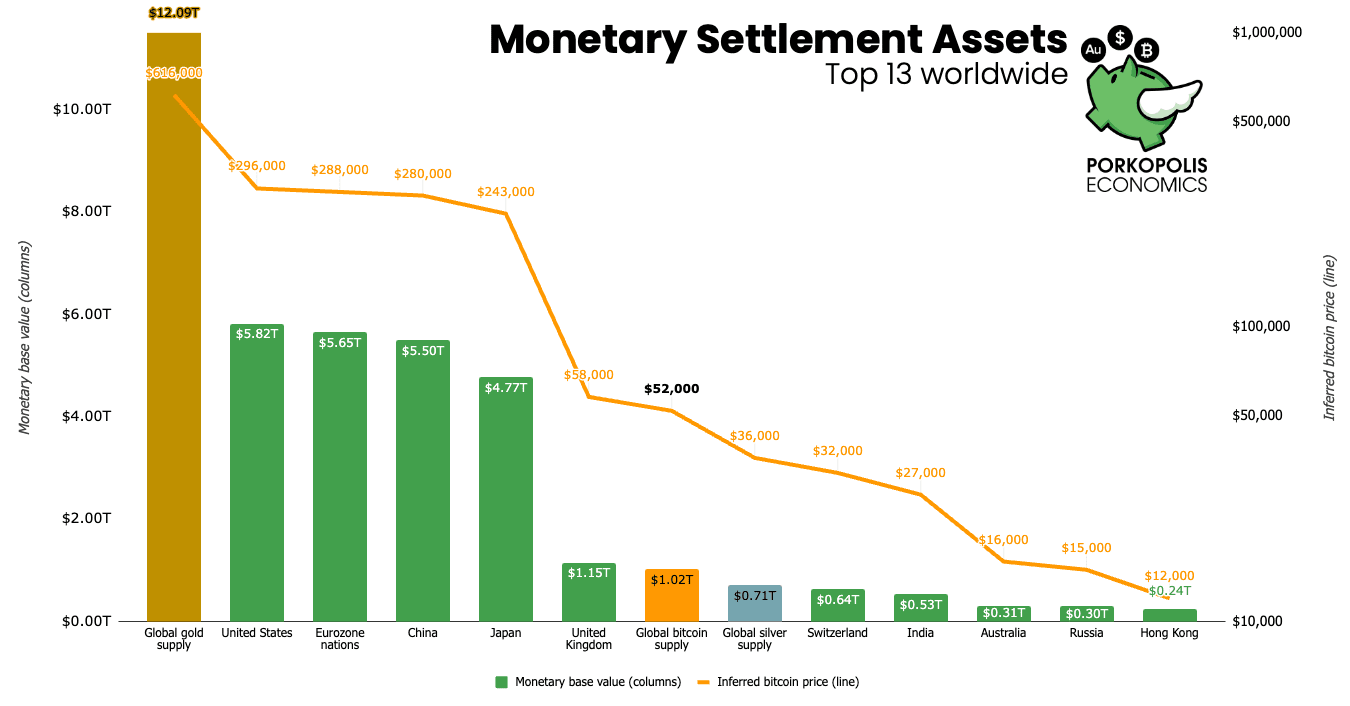
10/ Notice how there is only one more 'mid-major' currency left in #Bitcoin's path, before it gets to the Big Four.
That is the pound #sterling, and there is about 900 billion of them ($1.15 trillion equivalent) issued and outstanding by the central bank.
11/ Here's a table that shows how these assets have progressed over #Bitcoin's life.
The table only includes the top five currencies, gold, silver, and Bitcoin.
Quite remarkable. 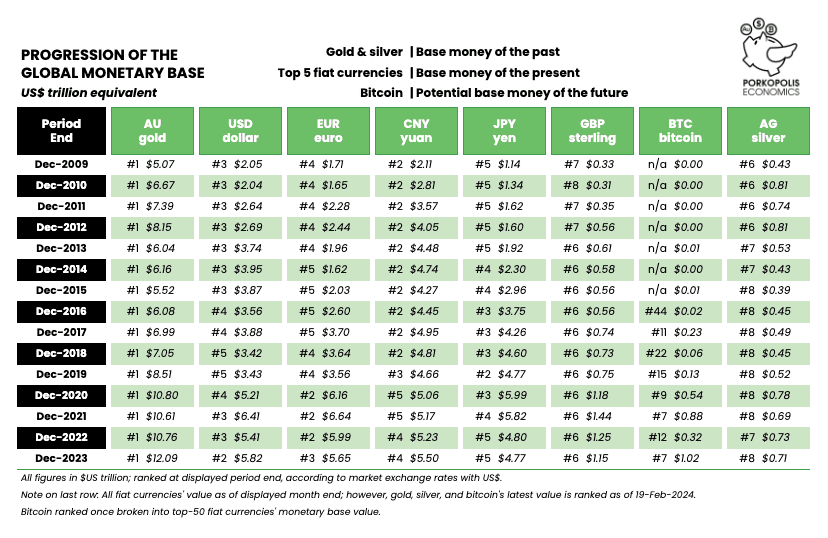
12/ If your country is not in the top five, here is a detailed table progression of the top 50 currencies in the world, and when #Bitcoin passed it... 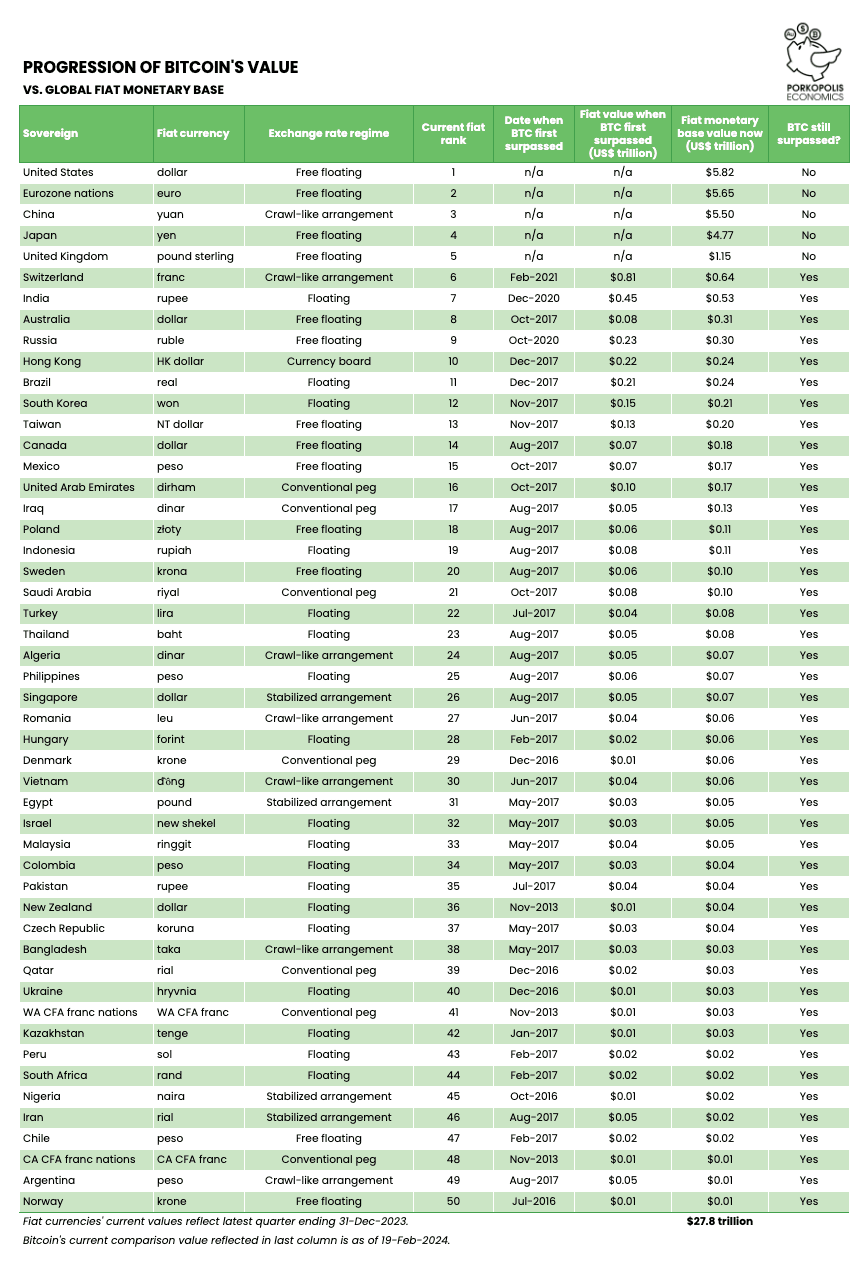
13/ Finally, this is the entire exhibit. For those interested in global macro and money, hopefully it helps you understand the big picture. 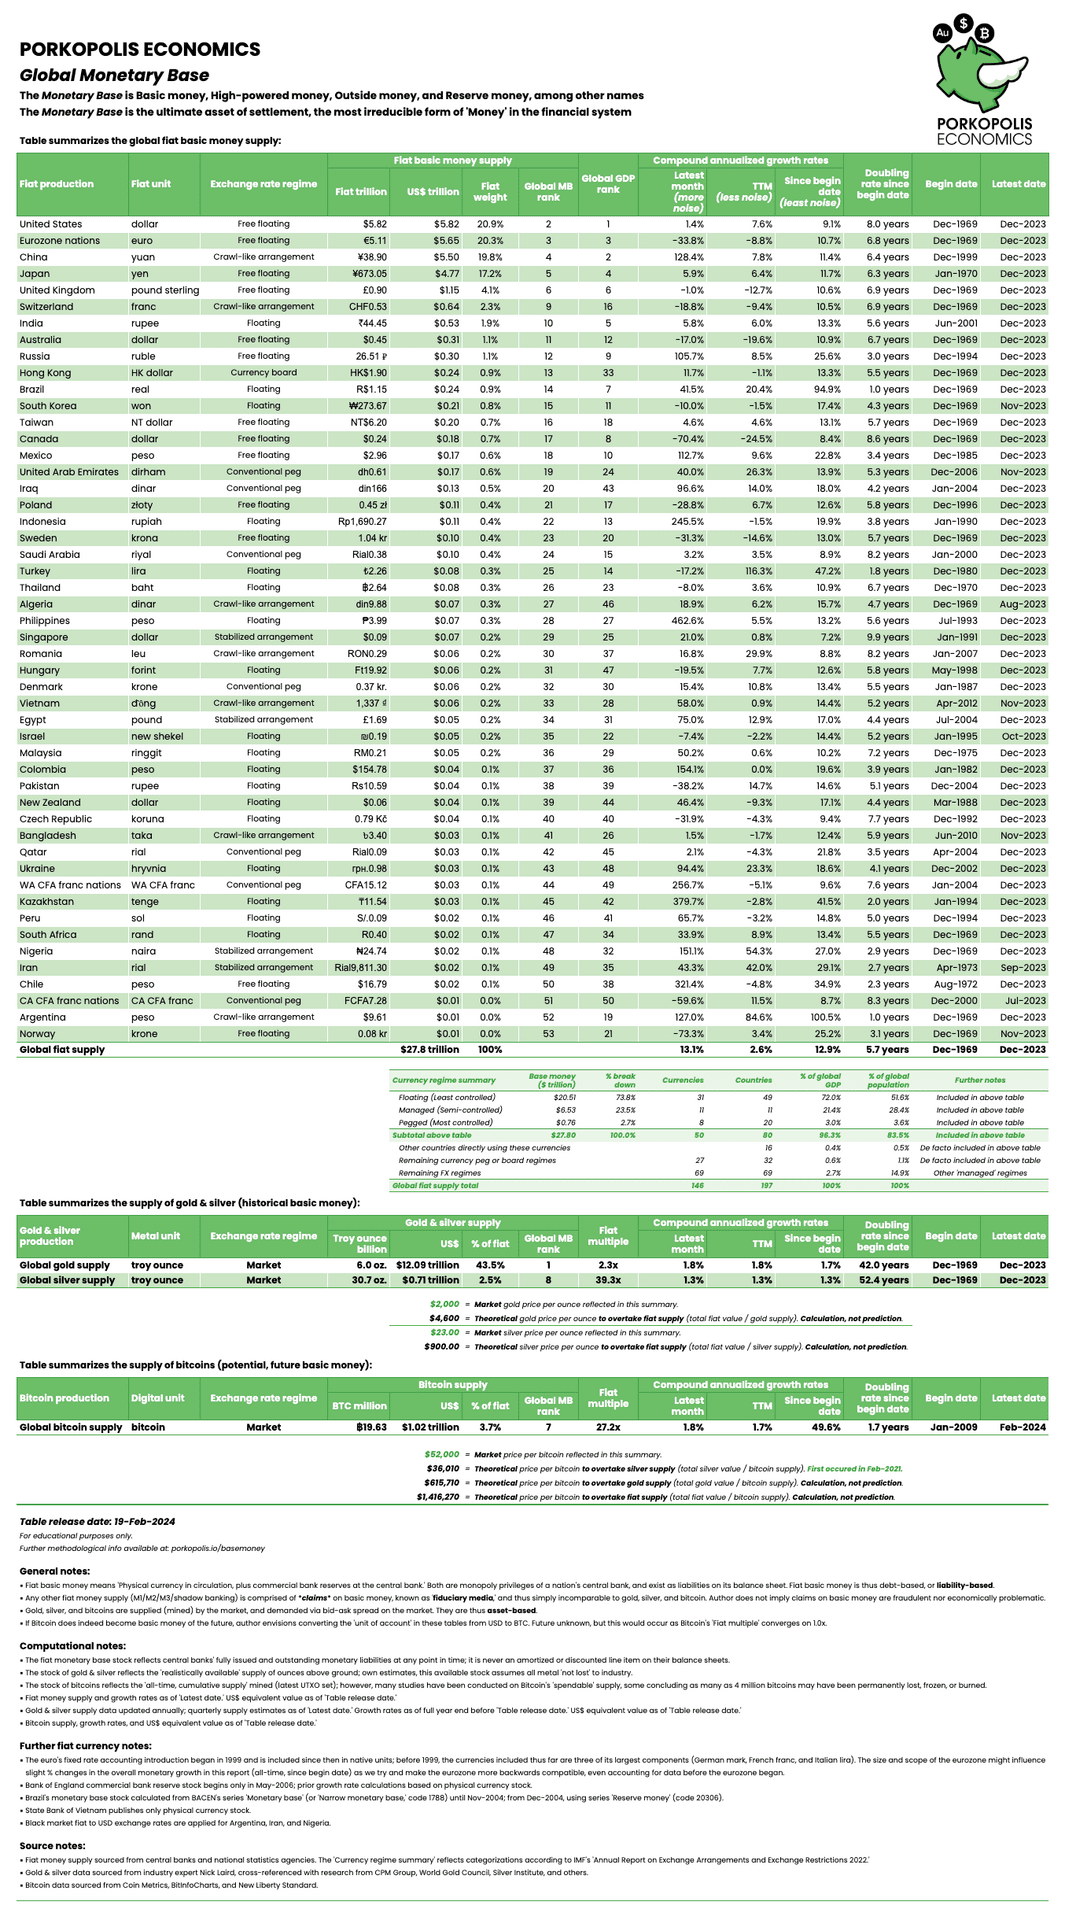
Thread collapsed
Thread collapsed
Thread collapsed
Thread collapsed
Thread collapsed