#investing #trading
#BTC /USDT #ElliottWave #VolumeProfile
Trading #Bitcoin is like composing music. Every note matters, and timing is everything.
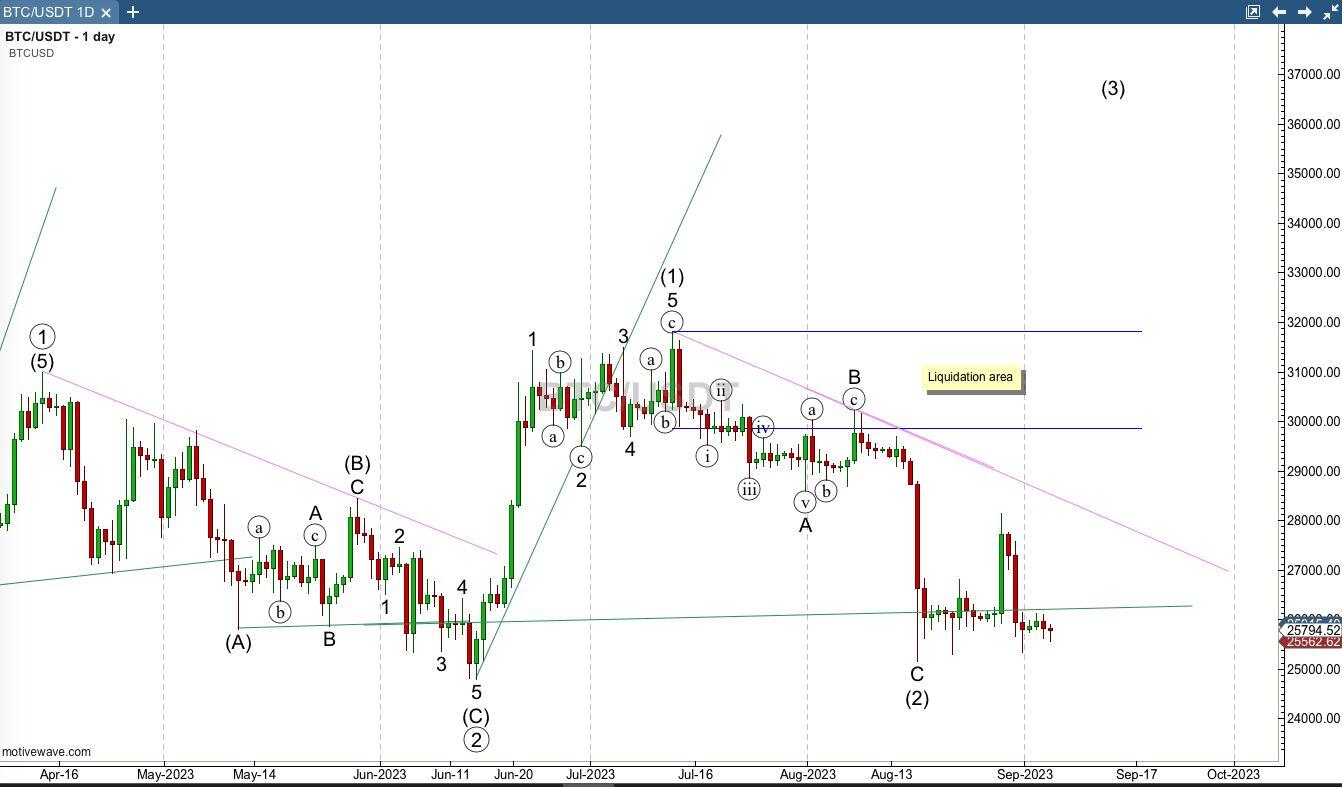
#Bitcoin #ElliottWave #GannPyrapoints
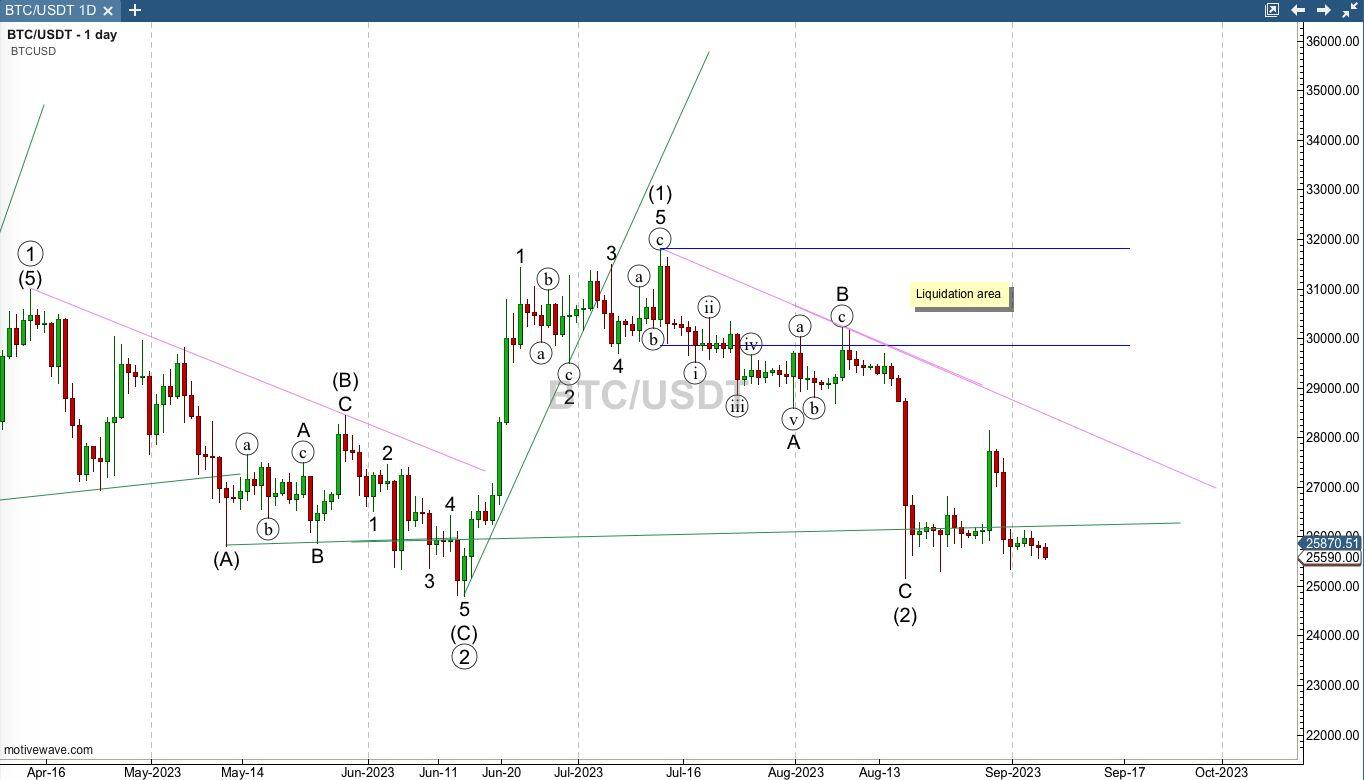
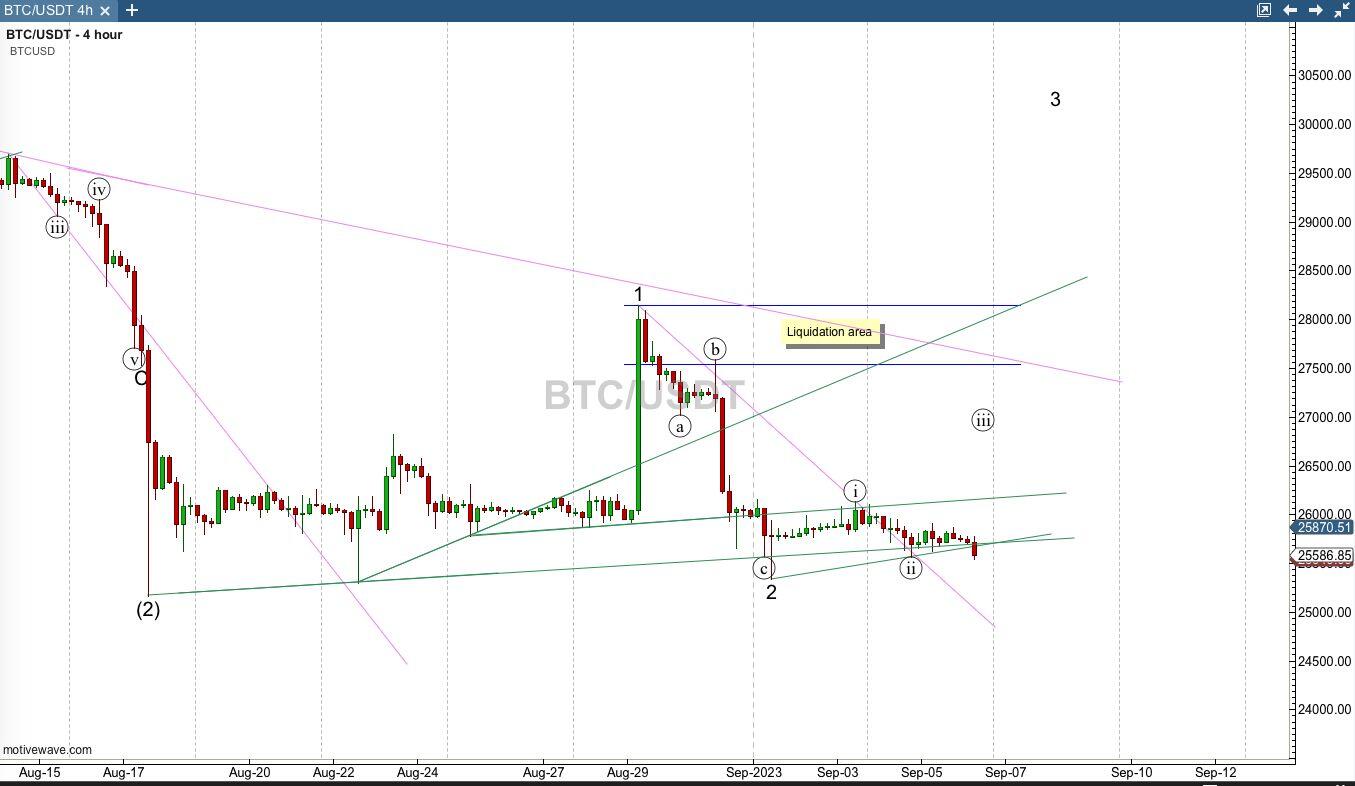
(Day, 4 hour)
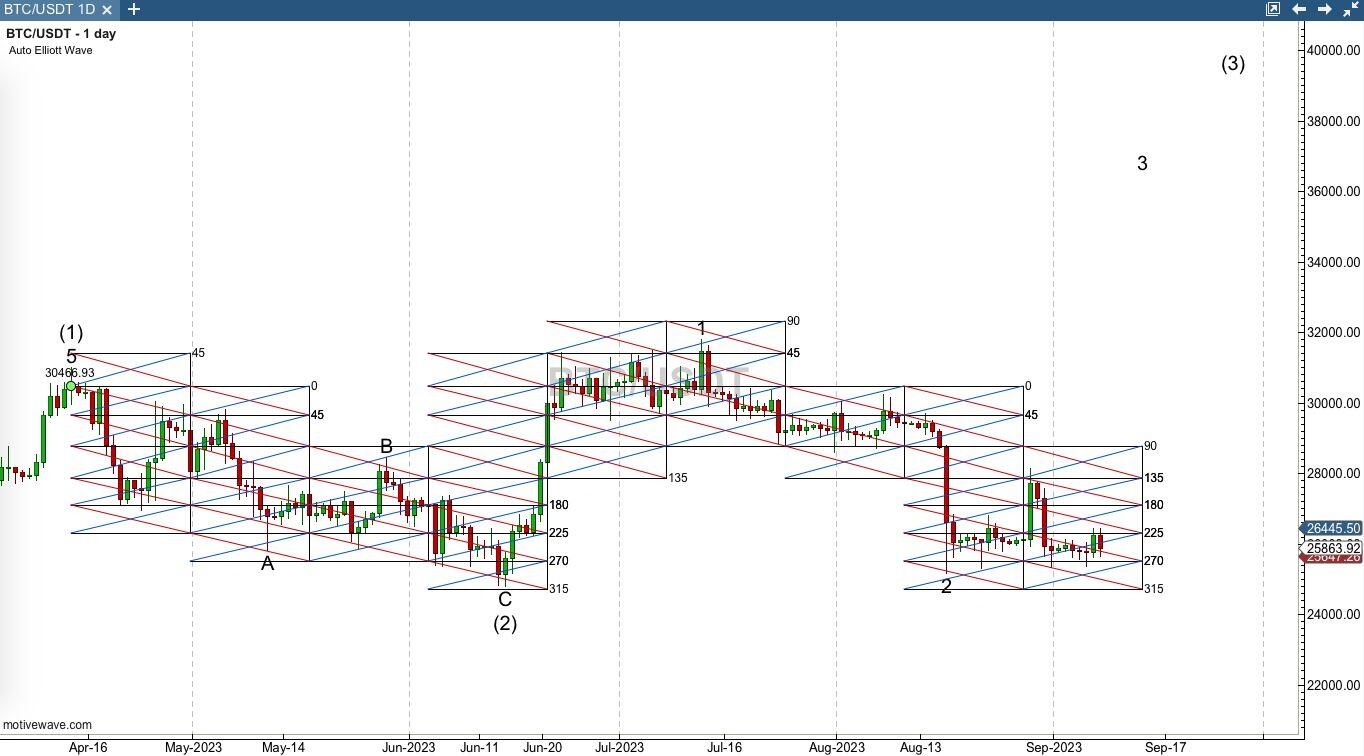
Gann Pyrapoints are a trading tool based on the principles of W.D. Gann's trading techniques.
The Pyrapoint tool is a plug-in tool that is based on the Pythagorean Cube and utilizes Gann's geometric constructions to divide time and price into proportionate parts.
The Pyrapoint tool draws horizontal and vertical lines on a chart, creating a pyramid-like structure.
The horizontal lines represent price levels, while the vertical lines represent time intervals. The intersection of these lines creates points that are used to identify potential support and resistance levels.
To draw Pyrapoints, traders need to identify a significant top or bottom and then use the Pythagorean Cube to calculate the price and time levels.
The Pythagorean Cube is a three-dimensional cube that represents the relationship between price, time, and space.
The cube is divided into eight smaller cubes, each representing a different time and price level. The Pyrapoint tool uses these levels to draw the horizontal and vertical lines on the chart.
Pyrapoints can be used to identify potential support and resistance levels, as well as to determine entry and exit points for trades.
Traders can also use Pyrapoints in conjunction with other technical analysis tools to confirm trading signals.
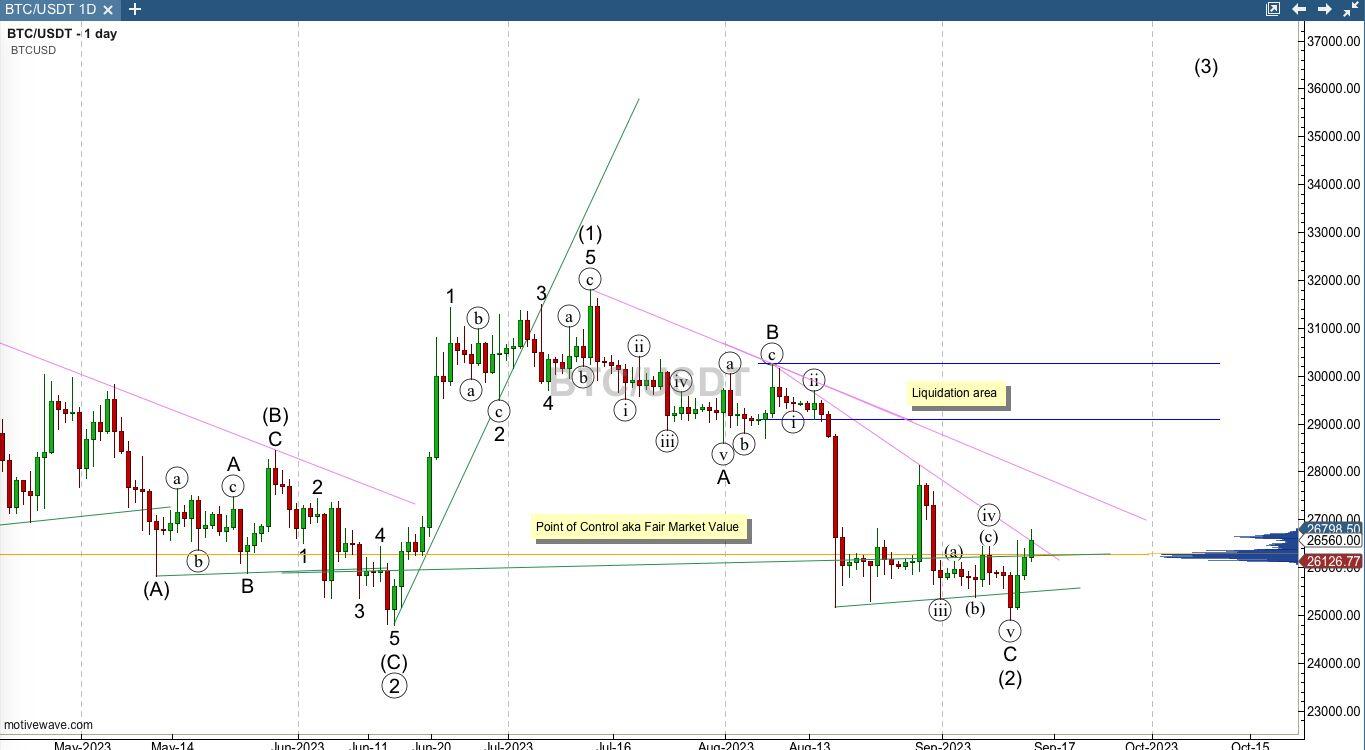
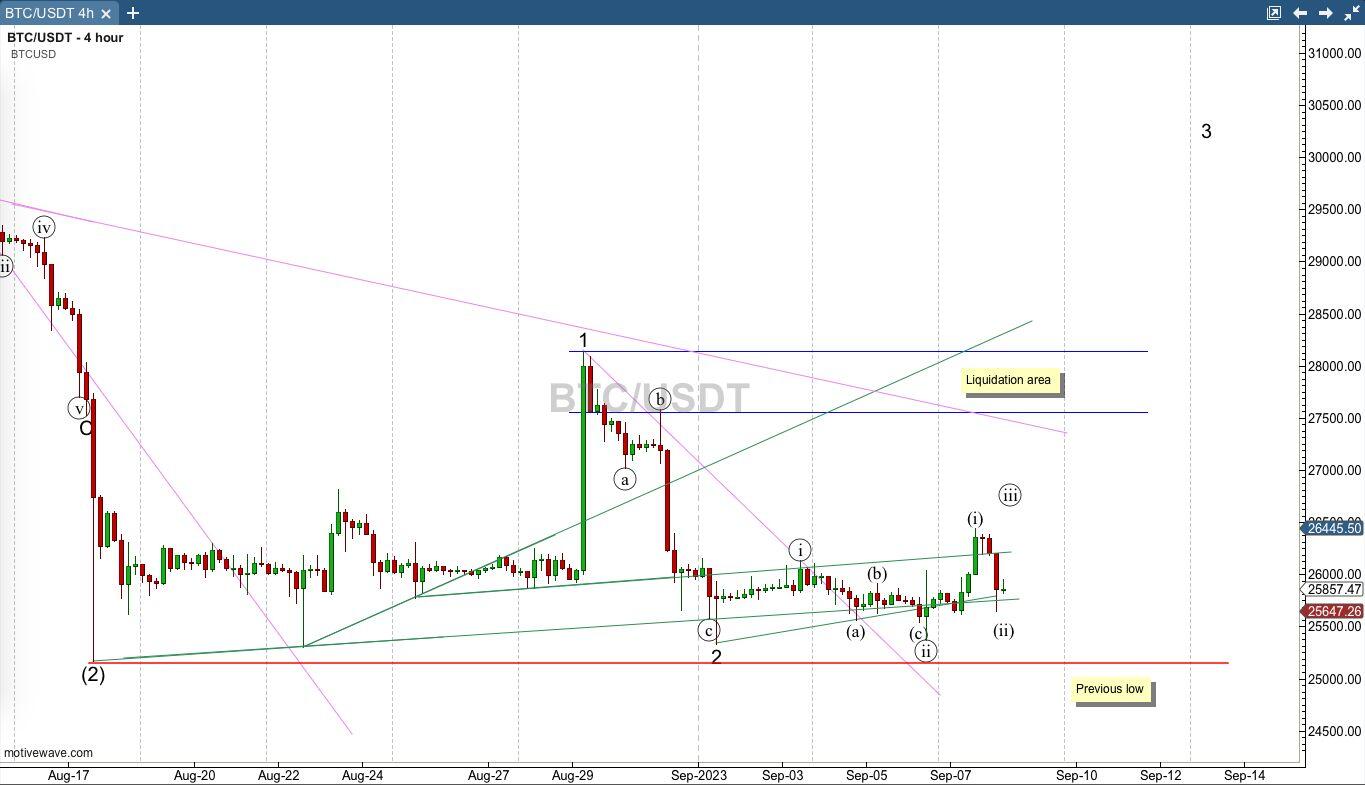
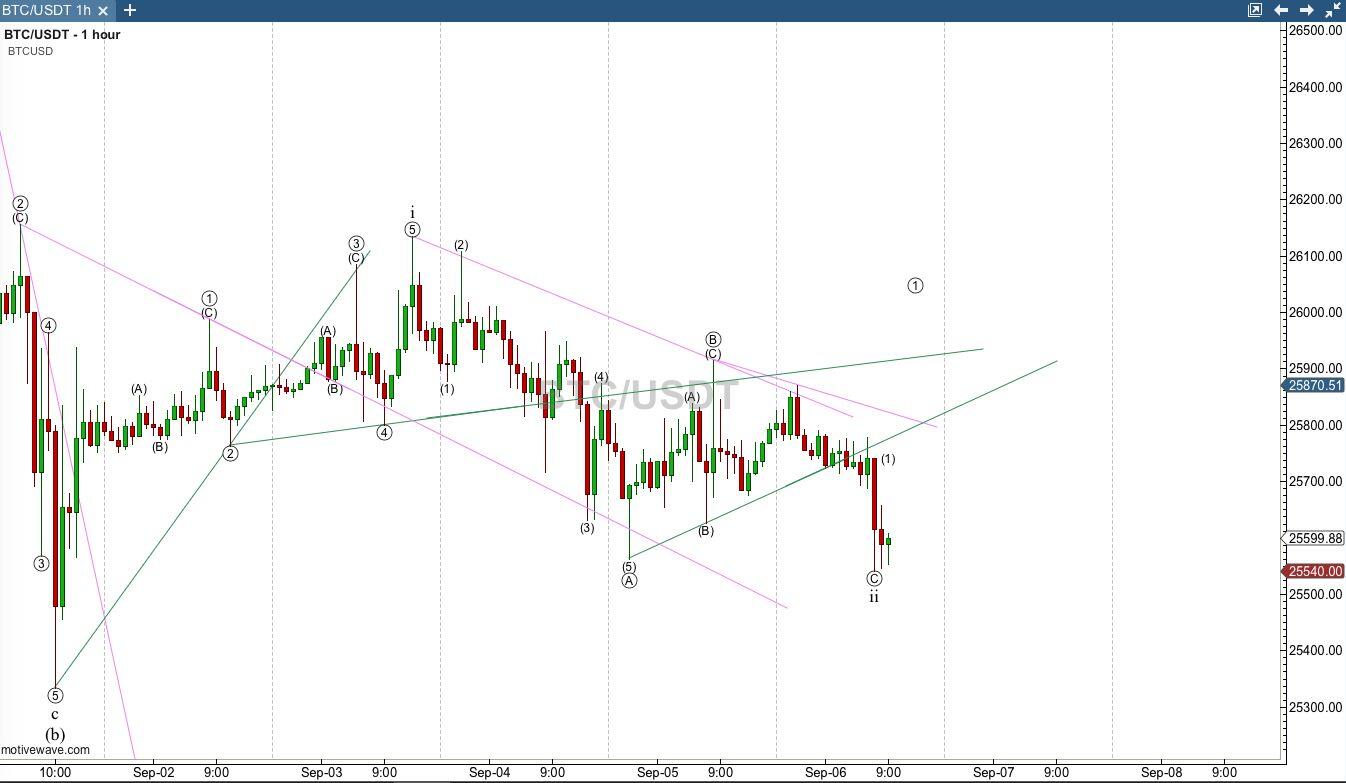
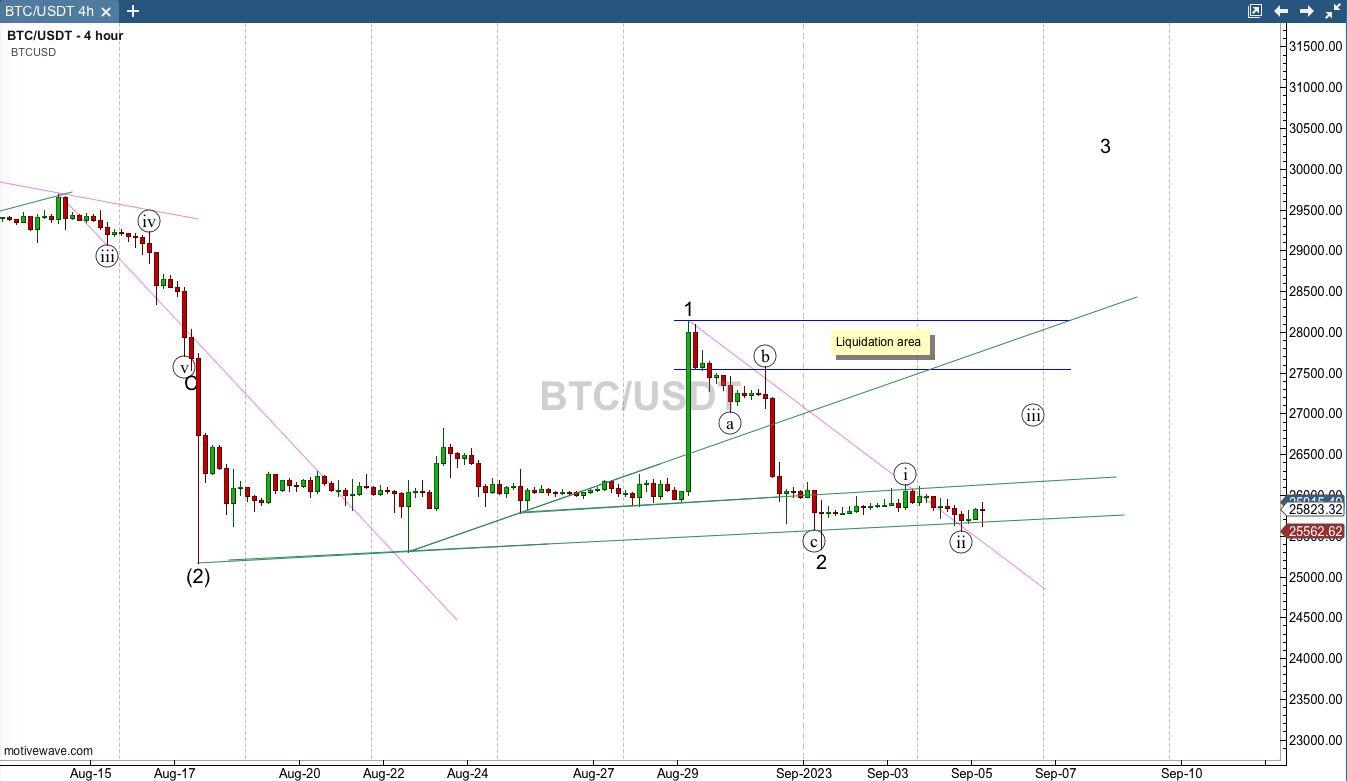
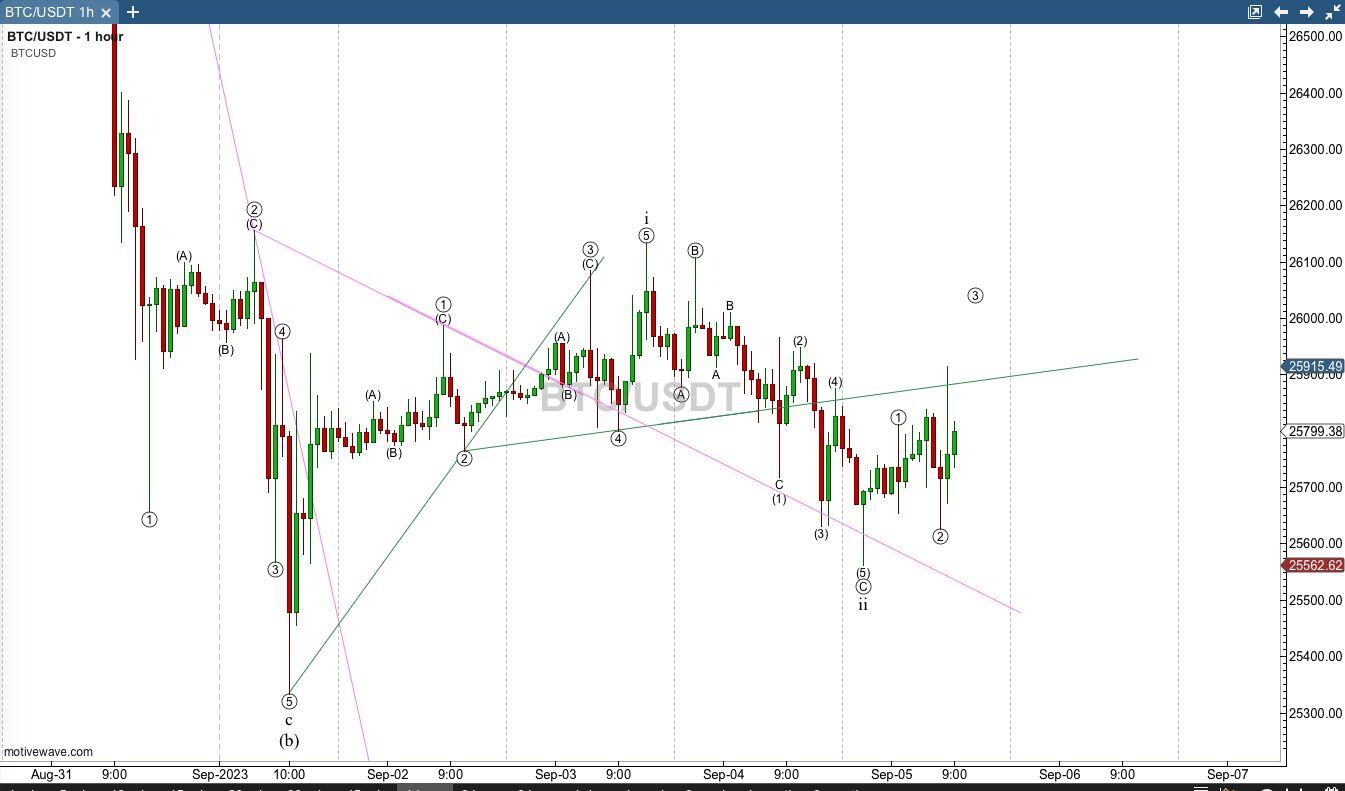
#BTC /USDT #ElliottWave (1 hour)

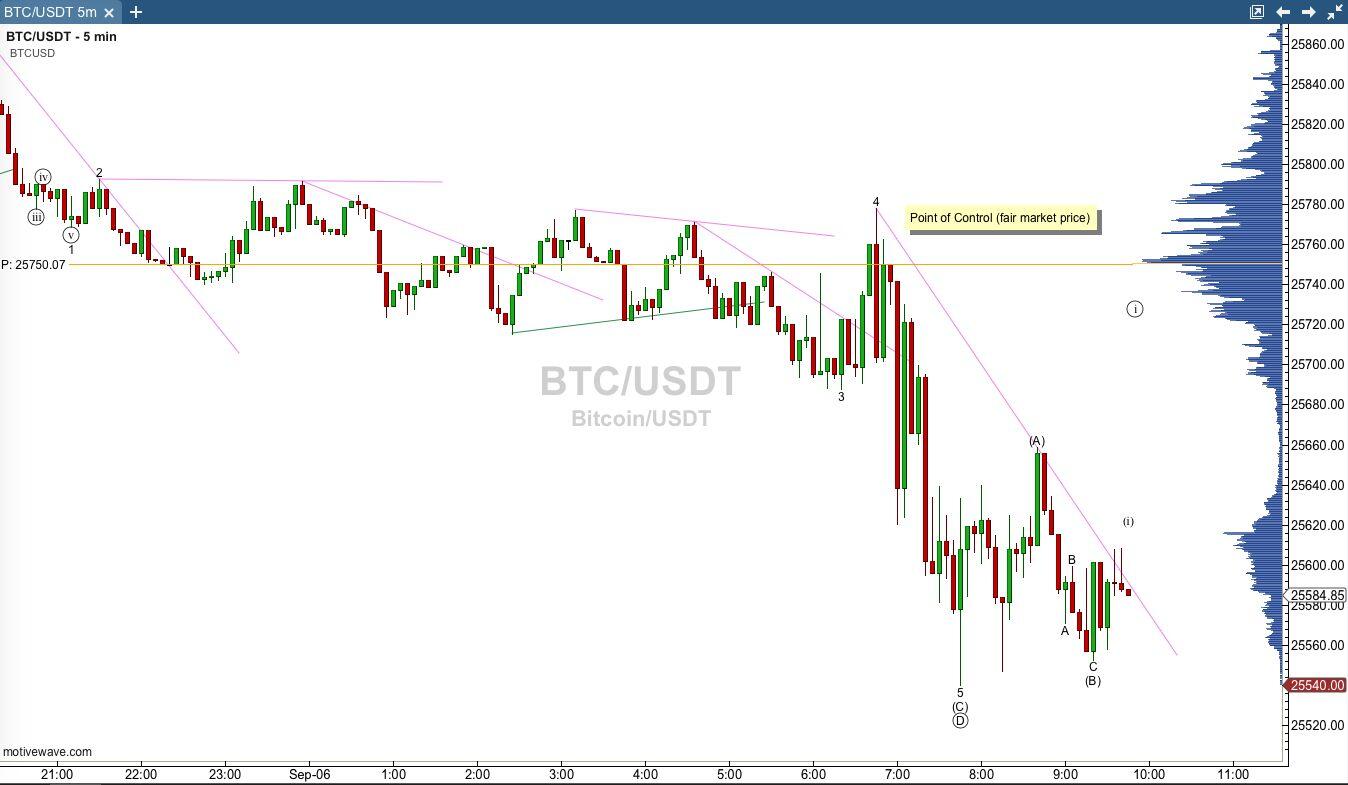
#VolumeProfile (Day)
Point of Control (POC) is the fair market price where the highest volume of buyers and sellers have met.

#Bitcoin
Bitcoin's volatility is driven by a complex interplay of factors, including supply and demand, speculation, media hype, government regulations, and the actions of large investors.


#investing #trading
The first step in learning how to make money by investing and trading is learning how to not lose money.
The first step in investing is learning how to not lose money.
. . . understanding
Moving Average Convergence Divergence
aka #MACD
"The best traders are always the most curious." - Paul Tudor Jones
https://youtu.be/exRqXUZP8tQ?si=jY3YYW7Qh2FgRuyY
The Moving Average Convergence Divergence, or MACD, is a popular and versatile technical indicator used by traders and investors to analyze and make informed decisions in financial markets.
In this comprehensive guide, we'll delve into the intricacies of the MACD, explaining its components, interpretation, and various trading strategies to help you make more informed trading decisions.
Understanding the MACD
The MACD is a trend-following momentum indicator that helps traders identify potential trend reversals, momentum shifts, and overbought or oversold conditions in a given asset.
It was developed by Gerald Appel in the late 1970s and has since become a fundamental tool for technical analysis.
Components of the MACD
MACD Line: The MACD line is calculated by subtracting the 26-period Exponential Moving Average (EMA) from the 12-period EMA.
The result is a single line that represents the short-term momentum of an asset. It is often referred to as the "fast line."
Signal Line: The signal line is a 9-period EMA of the MACD line. It acts as a smoother indicator and helps traders identify potential buy or sell signals.
When the MACD line crosses above the signal line, it generates a bullish signal, and when it crosses below, it generates a bearish signal.
Histogram: The histogram is simply the difference between the MACD line and the signal line.
It provides a visual representation of the divergence or convergence between the two lines. Positive histogram bars indicate bullish momentum, while negative bars indicate bearish momentum.
Interpreting the MACD
Bullish Signals: MACD Line Crosses Above Signal Line: This crossover indicates a potential bullish trend reversal or upward momentum. Traders often consider this a buy signal.
Positive Histogram Bars Increasing in Size: As the histogram bars move from negative to positive and increase in size, it signifies strengthening bullish momentum.
Bearish Signals: MACD Line Crosses Below Signal Line: This crossover indicates a potential bearish trend reversal or downward momentum. Traders often consider this a sell signal.
Negative Histogram Bars Increasing in Size: As the histogram bars move from positive to negative and increase in size, it signifies strengthening bearish momentum.
Trading Strategies with the MACD
1. MACD Crossover Strategy
Signal: Buy when the MACD line crosses above the signal line (bullish crossover), and sell when the MACD line crosses below the signal line (bearish crossover).
Considerations: This strategy is effective in trending markets and may produce false signals in choppy or sideways markets. Traders often use additional indicators or filters to confirm signals.
2. MACD Histogram Divergence
Signal: Look for divergences between the MACD histogram and price action. For example, if the price is making lower lows while the histogram is making higher lows, it can signal a potential bullish reversal.
Considerations: Divergence signals require careful observation and confirmation from other indicators or price patterns.
3. MACD and Price Confluence
Signal: Confirm buy or sell signals from the MACD with price action.
For instance, a bullish MACD crossover occurring near a significant support level can provide a stronger buy signal.
Considerations: Combining MACD with other technical analysis tools can enhance the reliability of signals.
4. MACD Overbought/Oversold Conditions
Signal: Identify overbought conditions when the MACD histogram reaches extreme positive levels and oversold conditions when it reaches extreme negative levels.
Consider selling in overbought conditions and buying in oversold conditions.
Considerations: Use this strategy cautiously, as overbought and oversold conditions can persist in strong trending markets.
In conclusion, the MACD is a powerful technical indicator that can assist traders in identifying trends, momentum shifts, and potential buy or sell signals.
However, like all trading tools, it is not infallible and should be used in conjunction with other analysis techniques and proper risk management.
By understanding the MACD's components and applying various trading strategies, you can improve your decision-making process in the financial markets.


Volume Profile
https://www.youtube.com/watch?v=JbtKyOFAht4
Volume profile is a powerful trading tool used by technical analysts and traders to gain insights into market activity and identify potential trading opportunities.
It provides a detailed view of how trading volume is distributed at various price levels over a specified period.
In this description, we'll delve into the concept of volume profile, its components, interpretation, and how it can be used in trading strategies.
Volume Profile Historical

Volume Profile Fixed

Understanding Volume Profile:
Volume profile, also known as volume-at-price or VP, is a graphical representation of trading volume data.
Unlike traditional price charts, such as candlestick or bar charts, which focus primarily on price movement over time, volume profile emphasizes the importance of volume at different price levels.
It helps traders understand the areas of high and low liquidity, where significant buying or selling activity has occurred.
Components of Volume Profile
To create a volume profile, you need historical trading volume data and corresponding price levels. Here are the main components:
Price Levels: The price levels are typically displayed on the horizontal axis of the chart, representing the range of prices during the selected time period.
These levels are divided into discrete increments, which can be ticks, points, or any specified unit.
Volume Bars/Blocks: On the vertical axis, you have volume bars or blocks that represent the total trading volume that occurred at each price level.
These bars are typically displayed as a histogram, with the height of each bar indicating the volume traded at that specific price level.
Value Area: The value area is a crucial concept within the volume profile. It is defined as the price range that contains a specified percentage of the total volume.
Commonly, the value area is set to encompass 70% of the total volume, leaving 15% above and below as the high and low volume areas, respectively.
Interpreting Volume Profile
Interpreting volume profile involves analyzing the distribution of volume across price levels to identify key trading insights.
Here are some important aspects to consider:
Point of Control (POC): The POC is the price level with the highest volume within the profile. It represents the "fair" or consensus price where most trading activity occurred during the chosen period. Traders often view the POC as a significant support or resistance level.
High Volume Nodes (HVN): HVNs are price levels with substantial trading volume. These levels can act as support or resistance, indicating areas where traders have previously shown strong interest.
Low Volume Nodes (LVN): LVNs represent price levels with relatively low trading volume. They are considered areas of less significant market interest and can act as potential breakout points.
Value Area: The value area, as mentioned earlier, helps traders identify the range within which most trading activity occurred. Traders often look for price action around the edges of the value area as potential entry or exit points.
Using Volume Profile in Trading
Volume profile can be applied in various trading strategies and timeframes. Here are some ways traders utilize it:
Support and Resistance: Traders use HVNs and LVNs as dynamic support and resistance levels. Price approaching an HVN may find support, while a breach of an LVN may signal a breakout.
Trading Breakouts: Volume profile can help identify areas with low volume (LVNs) where breakouts are likely to occur. A breakout above an LVN may indicate a bullish opportunity, while a breakout below may be bearish.
Trading Reversals: When price reaches extreme levels of the value area, it can indicate overbought or oversold conditions. Traders may look for reversals or corrections when price reaches these levels.
Scalping and Day Trading: Scalpers and day traders often use volume profile for short-term trades. They focus on intraday profiles to identify intraday levels of interest.
Swing Trading: Swing traders may use volume profiles on higher timeframes to identify key levels for swing trading setups, such as pullbacks to the POC.
Risk Management: Traders can use volume profile to set stop-loss levels based on key support and resistance areas within the profile.
Confirmation: Volume profile can be used in conjunction with other technical analysis tools, such as trendlines and oscillators, to confirm trading signals.
Limitations and Considerations
While volume profile is a valuable tool, it's essential to be aware of its limitations:
Data Quality: The accuracy of volume profile analysis depends on the quality and completeness of historical volume data.
Subjectivity: Interpretation can vary among traders, leading to subjective decisions about key levels.
Timeframe Dependency: The significance of volume profile levels can differ significantly based on the chosen timeframe.
Market Conditions: Volume profiles can change rapidly during news events and market shifts, impacting the validity of previous levels.
Not a Standalone Indicator: Volume profile is most effective when used in conjunction with other technical and fundamental analysis tools.
Conclusion
In summary, volume profile is a valuable trading tool that provides a unique perspective on market activity.
By analyzing the distribution of trading volume at different price levels, traders can identify key support and resistance areas, potential breakout points, and areas of market interest.
However, like any technical analysis tool, it should be used in conjunction with other indicators and considered within the broader context of market conditions.
Price Action
Price action in trading refers to the movement of an asset's price on a chart. It's a crucial aspect for traders to analyze and make informed decisions.
Price action has various characteristics.
1. Trends
"The trend is your friend until the end."
Trends are a fundamental aspect of price action analysis in trading. They reveal the prevailing direction of an asset's price movement over a given period.
Recognizing and understanding trends is essential for traders, as it provides crucial information about potential buying or selling opportunities.
Uptrends are characterized by a series of higher highs and higher lows. This pattern reflects increasing demand for the asset, as buyers are willing to pay higher prices.
Uptrends indicate a bullish sentiment in the market, with traders looking for opportunities to buy on pullbacks.
Downtrends on the other hand, exhibit lower highs and lower lows. This signifies decreasing demand, as sellers are more active and willing to accept lower prices.
Downtrends suggest a bearish sentiment, prompting traders to consider short-selling or staying on the sidelines.
Understanding trends involves using tools like trendlines and moving averages to visually confirm the direction of the trend.
Successful traders seek to align their strategies with the prevailing trend to increase the probability of profitable trades.
2. Support and Resistance
"The old support often becomes the new resistance." - Michael Covel
Support and resistance levels are critical concepts in technical analysis that help traders identify potential turning points in the market. These levels are determined by historical price action and play a significant role in traders' decision-making.
Support is a price level where the decline in an asset's price is likely to pause or reverse.
This occurs because buyers are more willing to enter the market and purchase the asset at this perceived "discounted" price. As price approaches a support level, traders look for signs of a potential bounce or reversal.
Resistance is a price level where the upward movement of an asset's price is likely to stall or reverse.
This happens as sellers become more active, possibly anticipating a price decline. When price approaches a resistance level, traders watch for potential signs of a reversal or a breakout above that level.
Identifying support and resistance levels involves analyzing historical price data and looking for areas where price has consistently reacted in the past. Traders often use these levels to set entry and exit points for their trades, as well as to manage risk.
3. Candlestick Patterns
"Candles do not only illuminate a room; they also cast shadows, revealing what might be hidden." - Joybell C.

Candlestick patterns originated in Japan in the 18th century as a method to analyze rice prices. The concept has since evolved to be used in various financial markets, including stocks, forex, commodities, and cryptocurrencies.
Each candlestick represents a specific time interval, such as a minute, hour, day, or week, and contains four crucial pieces of information:
1. Open Price: The price at which an asset began trading during the given time period.
2. Close Price: The price at which an asset finished trading during the same time period.
3. High Price: The highest price reached by the asset during the time interval.
4. Low Price: The lowest price reached by the asset during the same time interval.
These data points are visually represented on a candlestick chart, where the body of the candlestick shows the range between the open and close prices, while thin lines, known as "wicks" or "shadows," extend above and below the body to indicate the high and low prices.
Understanding Candlestick Patterns
Candlestick patterns are categorized into two main types: single candlestick patterns and multiple candlestick patterns.
Single Candlestick Patterns
1. Doji: A Doji candlestick has a small body and indicates market indecision. It forms when the open and close prices are nearly the same, showing that buyers and sellers are in equilibrium. Doji patterns can signal potential reversals.
2. Hammer and Hanging Man: These patterns have a small body and a long lower wick. The hammer occurs after a downtrend and suggests a potential bullish reversal. The hanging man appears after an uptrend and may indicate a bearish reversal.
3. Shooting Star and Inverted Hammer: Similar to the hammer and hanging man, these patterns have a small body and a long upper wick. The shooting star forms after an uptrend and could signal a bearish reversal.
The inverted hammer appears after a downtrend and might suggest a bullish reversal.
Multiple Candlestick Patterns
1. Engulfing Patterns: Bullish engulfing occurs when a larger bullish candle "engulfs" the previous bearish candle, indicating a potential uptrend. Bearish engulfing is the opposite, signaling a potential downtrend.
2. Morning Star and Evening Star: These three-candle patterns suggest a potential trend reversal.
The morning star involves a downtrend, a small-bodied candle, and a bullish candle. The evening star consists of an uptrend, a small-bodied candle, and a bearish candle.
3. Three White Soldiers and Three Black Crows: In an uptrend, three white soldiers are three consecutive bullish candles, indicating potential continuation.
Three black crows occur in a downtrend and suggest a potential continuation to the downside.
4. Tweezer Tops and Tweezer Bottoms: Tweezer tops form when two consecutive candles have the same high, indicating potential resistance. Tweezer bottoms have the same low and suggest potential support.
Using Candlestick Patterns in Trading:
Traders use candlestick patterns in conjunction with other technical indicators and analysis methods to make informed decisions. The presence of a specific pattern doesn't guarantee an outcome, but it provides valuable insights into market dynamics.
For example:
A bullish engulfing pattern at a support level might indicate a potential price reversal to the upside.
A doji candlestick after a prolonged uptrend could suggest a potential trend reversal.
A series of lower highs and lower lows accompanied by bearish candlestick patterns might indicate a strong downtrend.
Candlestick patterns are versatile and can be applied to various timeframes, from intraday trading to long-term investing.
However, traders should consider factors such as overall market conditions, volume, and other technical indicators to confirm their trading decisions.
4. Volatility
"Volatility is not a risk if you understand it." - Nassim Nicholas Taleb
Volatility measures the degree of price fluctuations in an asset's value over a given period. It is a crucial factor that impacts trading strategies and risk management.
Understanding volatility helps traders gauge the potential risk and reward of their trades.
High volatilityindicates that an asset's price is experiencing rapid and significant fluctuations within a short period. This can present opportunities for traders seeking short-term gains but also comes with increased risk.
Volatile markets often experience sharp price movements that can result from news events, earnings releases, or market sentiment shifts.
Low volatility on the other hand, suggests that an asset's price is relatively stable and experiencing smaller price movements.
While this can offer a more predictable trading environment, it may limit short-term profit potential. Traders seeking longer-term investments may find low volatility periods more suitable.
To measure volatility, traders often use technical indicators like the Average True Range (ATR) or Bollinger Bands.
By understanding volatility levels, traders can adjust their strategies, position sizes, and risk management techniques accordingly.
5. Breakouts and Breakdowns
"The first rule of trading is: preserve your capital. - Larry Hite
Breakouts and breakdowns occur when an asset's price moves above a resistance level or below a support level, respectively.
These price movements are significant events in technical analysis, as they can indicate potential trend continuations or reversals.
A breakout happens when the price surpasses a resistance level, suggesting that buyers are gaining control and that a potential uptrend is forming. Traders often look for strong volume confirmation when identifying breakouts to increase their confidence in the trend's validity.
A breakdown occurs when the price drops below a support level, indicating that sellers are taking charge and that a potential downtrend is emerging.
Similar to breakouts, traders seek substantial volume alongside breakdowns to confirm the potential trend reversal.
Successful trading during breakouts and breakdowns requires careful analysis and risk management. Traders need to be cautious of false breakouts or breakdowns, which can lead to losses if not properly identified.
6. Reversal Patterns
"The trend is your friend until it bends."
- Ed Seykota
Reversal patterns are formations that suggest a potential change in the prevailing trend direction. These patterns often signal a transition from an existing trend to a new one, making them valuable tools for traders seeking trend reversal opportunities.
A head and shoulders pattern is a classic reversal formation that consists of three peaks. The middle peak (the head) is higher than the other two (the shoulders).
This pattern suggests a shift from an uptrend to a potential downtrend.
Double tops and double bottoms are reversal patterns formed by two consecutive price peaks (double tops) or troughs (double bottoms) at approximately the same level.
These patterns indicate potential trend reversals.
Triple tops and triple bottoms extend the concept to three peaks (triple tops) or troughs (triple bottoms) near the same level. These patterns are less common but are considered even stronger indications of trend reversals.
Recognizing reversal patterns requires careful observation and analysis of price movements. Traders often combine these patterns with other technical indicators to increase the likelihood of accurate predictions.
7. Range-bound Markets
"In the midst of chaos, there is also opportunity." - Sun Tzu
Range-bound markets are characterized by price movements that remain confined within a defined range.
During these periods, prices oscillate between support and resistance levels, without establishing a clear trend direction.
Traders often refer to range-bound markets as "consolidation" or "sideways" movements.
During range-bound conditions, traders look for opportunities to buy near support levels and sell near resistance levels.
Price reversals are less likely within the range itself, but breakout or breakdown events can occur once the price escapes the established boundaries.
Range-bound markets can provide opportunities for shorter-term traders seeking to capitalize on frequent price fluctuations.
8. Market Sentiment
"Price is what you pay; value is what you get." - Warren Buffett
Market sentiment refers to the collective emotions, opinions, and perceptions of market participants. Price action is heavily influenced by sentiment, as traders' decisions are driven by factors like fear, greed, optimism, and pessimism.
Sharp price movements can result from extreme emotions, such as panic selling during a market crash or euphoric buying during a bull market rally.
Understanding market sentiment helps traders gauge the potential direction and strength of price movements.
By analyzing news, economic indicators, and market psychology, traders can gain insights into prevailing sentiment.
However, it's important to combine sentiment analysis with technical and fundamental analysis for a well-rounded perspective.
9. Volume
Volume is the measure of the number of shares, contracts, or units traded within a specified time period.
High volume suggests strong participation and often confirms the strength of a price movement. Low volume, on the other hand, can indicate weaker market participation and potential trend reversals.
In uptrends, rising prices accompanied by high volume indicate strong buying interest.
Conversely, in downtrends, falling prices coupled with high volume reflect increased selling pressure. Traders analyze volume to assess the validity of price movements and make more informed trading decisions.
Volume analysis is often used alongside other technical indicators to confirm trends and potential reversals.
Understanding volume patterns helps traders avoid trading in illiquid or manipulated markets and enhances their ability to spot genuine trends.
10. Timeframes
"The more you know about a situation, the less fear it has." - Ralph Waldo Emerson
Timeframes refer to the duration of a single candlestick or the chart interval used for analysis. Traders use various timeframes, such as minutes, hours, days, weeks, and even months, to gain different perspectives on price action.
Short-term traders, like day traders, focus on smaller timeframes to capture rapid price movements within a single session.
Long-term investors, however, analyze larger timeframes to identify overall trends and make more patient investment decisions.
Analyzing multiple timeframes helps traders avoid tunnel vision and provides a more comprehensive view of market dynamics.
A trend that appears on a short-term timeframe might differ from the trend observed on a larger timeframe.
11. Price Patterns
"Patterns repeat because human nature doesn't change." - Jesse Livermore

Price patterns are distinct formations that appear on price charts and provide insights into potential future price movements.
These patterns are created by the collective actions of traders and investors, reflecting common behavioural patterns.
Patterns like triangles (symmetrical, ascending, descending), flags, and wedges suggest that a continuation or reversal of the current trend is likely.
Symmetrical triangles indicate a period of indecision, while ascending and descending triangles hint at potential breakout or breakdown directions.
Flags and pennants are short-term continuation patterns that occur after a strong price movement. These patterns represent brief pauses before the market resumes its previous trend.
Identifying and correctly interpreting price patterns require practice and experience. Traders often combine pattern analysis with other technical tools to make more confident predictions.
12. Divergence
Divergence occurs when the price movement of an asset diverges from the movement of a relevant technical indicator, such as an oscillator or moving average.
Divergence signals potential shifts in price momentum and trend direction.
Bullish divergence happens when the price forms lower lows while the indicator forms higher lows. This suggests that the downtrend is losing momentum, potentially leading to a bullish reversal.
Bearish divergence occurs when the price forms higher highs while the indicator forms lower highs. This indicates that the uptrend might be weakening, potentially leading to a bearish reversal.
Divergence analysis requires a good understanding of technical indicators and their relationship with price movements.
It can provide valuable insights into potential trend reversals and help traders anticipate market shifts.
In conclusion, the characteristics of price action in trading encompass a wide range of factors that provide insights into market dynamics.
By understanding trends, support and resistance, candlestick patterns, volatility, breakouts, breakdowns, reversal patterns, range-bound markets, market sentiment, volume, timeframes, and divergence, traders can make informed decisions and improve their trading strategies.
These characteristics, when used collectively and in combination with other analysis techniques, empower traders to navigate the financial markets with greater precision and confidence.
Fair Value

Fair Value signifies a price range in which market participants engage in a significant volume of trades, indicative of a delicate balance between buyers and sellers.
This equilibrium fosters narrow price fluctuations and heightened trading activity. When a security is said to be trading at fair value, it implies a state of equilibrium has been reached.
Within the realm of Market Profile Traditionalists, Fair Value is ascertained by utilizing 70% of the session's volume instead of the conventional 68.2%.
The point of control, functioning as the average, stems from the location where the most transactions occurred, as evidenced by the highest volume of trades.
Consequently, prices that deviate from the high-volume fair value threshold are deemed "unfair." These prices are perceived as failing to accurately reflect the genuine intrinsic worth of the traded security.
Market imbalances emerge due to market events that thrust either buyers or sellers into an assertive role. These imbalances stem from circumstances compelling one group to take the lead over the other.
Market Auction Theory

Market Auction Theory serves as a fundamental framework for comprehending the intricate mechanics that underlie the operation of financial markets.
At its core, this theory elucidates that markets serve as a dynamic platform to facilitate the exchange of various financial instruments, with prices being determined through an ongoing and iterative process of price discovery.
In essence, the fluid interplay of supply and demand forces propels prices to oscillate, seeking equilibrium at a point where optimal transaction volumes can materialize.
The foundational premise of Market Auction Theory is rooted in the notion that financial markets are akin to a bustling auction, where buyers and sellers converge to engage in the exchange of assets.
This analogy serves as a powerful lens through which to examine the intricate dynamics at play.
Much like bidders in an auction competing to secure their desired items, market participants engage in a perpetual contest to attain favourable prices for the assets they seek to buy or sell.
A crucial facet of this theory is the concept of price discovery—a continual process that entails the revelation of an asset's optimal market value through the collective actions and decisions of market participants.
Price discovery encapsulates the amalgamation of myriad factors, including economic indicators, corporate performance, geopolitical events, and investor sentiment.
This intricate interweaving of information serves as the compass guiding the trajectory of asset prices.
The ebb and flow of prices within financial markets mirror the perpetual flux of an auctioneer's gavel, as bids and offers interact in a ceaseless tango.
Buyers and sellers constantly reassess their valuations based on incoming data, news, and developments. In response to these shifting perceptions, prices adapt to reflect the consensus of market participants at any given moment.
This adaptation is a reflection of the core tenet of Market Auction Theory—the pursuit of an equilibrium price where trading activity can be most efficiently executed.
A pivotal concept that underscores the theory's essence is the notion of market liquidity—a measure of the ease with which assets can be bought or sold without causing significant price fluctuations.
Market Auction Theory posits that during times of high liquidity, price movements are relatively modest, allowing participants to execute transactions swiftly and with minimal impact on prevailing prices.
Conversely, periods of low liquidity can lead to more substantial price swings, as the scarcity of willing buyers or sellers amplifies the market's sensitivity to incoming orders.
Auction formats in financial markets can vary, each presenting distinct nuances in the dynamics of price formation. The continuous auction, a prevalent model, operates without distinct trading sessions, fostering an environment of uninterrupted trading.
This format is exemplified by stock exchanges, where a constant stream of buy and sell orders converge to shape real-time prices.
Alternatively, call auctions, typified by opening and closing sessions in some markets, enable participants to aggregate their orders before executing trades at a single calculated price.
These divergent formats exemplify the adaptability of Market Auction Theory to various market structures.
The symbiotic relationship between price movement and transaction volume constitutes a hallmark of Market Auction Theory.
As prices oscillate, they traverse through zones of equilibrium, where buyers and sellers find mutual satisfaction in executing transactions.
This convergence signifies the optimal point at which market activity can unfold unhindered. As buyers perceive value in the assets at hand, and sellers aim to capitalize on favourable price levels, the equilibrium zone becomes a fertile ground for vibrant trading volumes to materialize.
It is imperative to recognize that Market Auction Theory does not exist in isolation; rather, it intertwines with behavioural economics, technological advancements, and regulatory frameworks.
The advent of electronic trading platforms has revolutionized the pace and scale of price discovery, enabling a global network of participants to interact instantaneously.
Moreover, the influence of cognitive biases and herd behaviour, as observed in behavioural economics, can sway the delicate balance of price equilibrium, leading to instances of market overshooting or undershooting intrinsic values.
The regulatory landscape also intersects with Market Auction Theory, as market oversight and investor protection mechanisms seek to ensure fair and transparent trading environments.
Regulations that prevent market manipulation, ensure timely dissemination of material information, and uphold the integrity of transactions all contribute to sustaining the principles underpinning the theory.
In conclusion, Market Auction Theory stands as a cornerstone for unraveling the intricacies of financial markets.
It postulates that markets function as dynamic auction arenas, where prices are a product of an ongoing process of price discovery. This discovery is an amalgamation of factors that influence the perceptions of buyers and sellers, driving prices to seek equilibrium.
The perpetual interplay of supply and demand, coupled with market participants' continuous reassessment of valuations, engenders an environment where transactions can be executed efficiently.
This theory's relevance extends beyond the theoretical realm, permeating market structures, behavioural dynamics, technological advancements, and regulatory paradigms.
As financial markets evolve, Market Auction Theory remains an invaluable compass for navigating the ever-changing landscape of price determination and trading dynamics.
#Bitcoin
The Trader's Edge
The "Big Guys," the Institutional traders control and manipulate the markets.
It's their game!
And they don't use indicators and algorithms the majority of retail traders use.
Only 5% of retail traders, that's you and me, are consistently profitable.
If you're not one of the 5%,
. . . now's your opportunity!
Elliott Wave Basics
The Elliott Wave Principle is a theory of market analysis developed by Ralph Nelson Elliott in the late 1920s.
It is based on the concept that financial markets, such as stocks, forex or currencies, move in repetitive patterns driven by human psychology. The main points of the Elliott Wave Principle can be summarized as follows:
1. Wave Principle: The market's price movements are composed of waves that follow specific patterns and cycles.
These waves can be classified into two main types: impulsive waves (trending) and corrective waves (counter-trend).
2. Five-Wave Pattern: Impulsive waves consist of five smaller waves labeled 1, 2, 3, 4, and 5. Waves 1, 3, and 5 are in the direction of the primary trend, while waves 2 and 4 are corrective movements.
3. Three-Wave Pattern: Corrective waves consist of three smaller waves labeled A, B, and C. Wave A is a corrective move against the primary trend, followed by a partial retracement in wave B, and finally, wave C moves in the direction of the primary trend to complete the correction.
Volume Profile Trading Masterclass l
Understanding Volume Profile
Volume Profile Trading Masterclass ll
The market is a constantly evolving puzzle. As traders, our job is to find the missing pieces.
- Linda Bradford Raschke
Mastering Volume Profile: Unveiling Market Dynamics and Trading Opportunities
1. Identifying Key Support and Resistance Levels: By analyzing the volume traded at different price levels, traders can identify areas where significant buying or selling activity has occurred.
These levels can act as support and resistance, influencing future price movements.
2. Determining Logical Take Profits and Stop Losses: Volume Profile can help traders establish appropriate levels for taking profits or setting stop-loss orders.
Areas with substantial trading volume can serve as potential profit-taking or risk management points.
3. Calculating Initial R Multiplier: In trading, the "R" factor represents the risk per trade.
By assessing the volume at different price levels, traders can determine the initial R multiplier, which helps in setting position sizes based on their risk tolerance.
4. Identifying Balanced vs. Imbalanced Markets: Volume Profile can reveal whether the market is balanced, with relatively equal buying and selling activity, or imbalanced, where one side (buyers or sellers) dominates.
Understanding market balance can provide insights into potential shifts in price direction.
5. Determining the Strength of Trends: Volume Profile can assist in assessing the strength of price trends.
In a strong uptrend, higher volumes are typically observed near the price's recent highs, while in a strong downtrend, higher volumes are seen near the price's recent lows.
Elliott Wave Blocks Trading Masterclass l
Understanding Elliott Wave Blocks Key Characteristics and Significance in Trading
Consolidation Zones: Elliott Wave Blocks represent periods of consolidation in the market where price action stalls and trades within a relatively narrow range.
These zones can be identified on a price chart as horizontal regions with limited price movement.
Volume and Liquidity: Elliott Wave Blocks usually have higher trading volume and liquidity, indicating that a significant number of market participants are actively involved in trading at these levels.
This suggests that there is a strong presence of buyers or sellers at those price points.
Support and Resistance: When a price moves through an Elliott Wave Block, it can act as either a support level if price moves up from the block or a resistance level if price moves down from the block.
Traders often watch these areas closely as they can offer potential entry or exit points for trades.
Market Sentiment: Elliott Wave Blocks can give insights into market sentiment.
For example, a bullish order block could indicate a strong demand area where buyers are accumulating, while a bearish order block might suggest a significant supply zone where sellers are dominating.
Confirmation and Trading Strategies: Traders may use Elliott Wave Blocks as part of their analysis and confirmation for trading decisions.
For instance, if price approaches a previous Elliott Wave Block that acted as strong resistance, traders might look for sell signals in that area. Conversely, if price nears a previous bullish order block, they might consider potential buy signals.
Time Frames: Elliott Wave Blocks can be observed on various time frames, from intraday charts to higher time frames like daily or weekly charts.
Blocks that appear on higher time frames tend to carry more significance and can influence price action over longer periods.
Elliott Wave Blocks Trading Masterclass ll
Probability thinking is a trader's most valuable tool.
- Alexander Elder
Want to learn more?