
Have a good week! Here's your Monday ice update - #Arctic sea ice extent is currently the 6th lowest on record (JAXA data)...
• about 3,000 km² below the 2010s mean
• about 1,020,000 km² below the 2000s mean
• about 2,010,000 km² below the 1990s mean
• about 2,680,000 km² below the 1980s mean
Other polar climate plots: https://zacklabe.com/arctic-sea-ice-figures/

Join me in tracking this year's #Arctic sea ice minimum!
Sea ice melt substantially slows every September as solar energy decreases and temperatures drop.
No new records are likely this year for the minimum. Follow along at https://zacklabe.com/arctic-sea-ice-extentconcentration/

nostr:npub1cuwc7q5gyx8d52ghx6lzkxlcr39w3rs7syg49pc5zrp55knldc4s2suzy6 I am sorry! I was trying to be consistent with the other plots posted.
I've actually found the North Atlantic notation to be confusing from the very beginning. I am used to it referring to the warming hole region and its associated climate variability.
nostr:npub1fnmqugg5v38qlucydtp78774pls42urpgwur6ztktjsk7s2m3mas9r9cle nostr:npub1zuuhj24qyasc9qeuyuqtdgc63ag05pwq5mve76qg0mysuw0agu0qdvrpz7 Unfortunately not recently anyways! Just a few commentary pieces, like https://journals.ametsoc.org/view/journals/bams/100/5/bams-d-18-0228.1.xml, https://gc.copernicus.org/articles/6/11/2023/, https://www.nature.com/articles/nclimate3162, https://www.tandfonline.com/doi/full/10.1080/21500894.2020.1769718, https://psycnet.apa.org/record/2022-32124-001 or research on best practices for data visualization (like color schemes). Though there is some more work on visualization of climate change data that is a bit older (e.g., https://wires.onlinelibrary.wiley.com/doi/full/10.1002/wcc.162 and https://doi.org/10.1080/17524032.2016.1176946).
nostr:npub1a6d6knkr9kn8f4fhe8kx2kta7pq8jxsajamy4mmpvwj6382dfhfqpca8sd This was a combination of poleward heat transport in the Arctic (https://www.worldweatherattribution.org/north-pole-nov-dec-2016/) and a sudden shit in Antarctic sea ice levels (https://agupubs.onlinelibrary.wiley.com/doi/full/10.1002/2017GL074691).
Enjoy your week! Here's your Monday ice update - #Arctic sea ice extent is currently the 10th lowest on record (JAXA data)...
• about 130,000 km² above the 2010s mean
• about 870,000 km² below the 2000s mean
• about 1,770,000 km² below the 1990s mean
• about 2,470,000 km² below the 1980s mean
Other plots: https://zacklabe.com/arctic-sea-ice-figures/

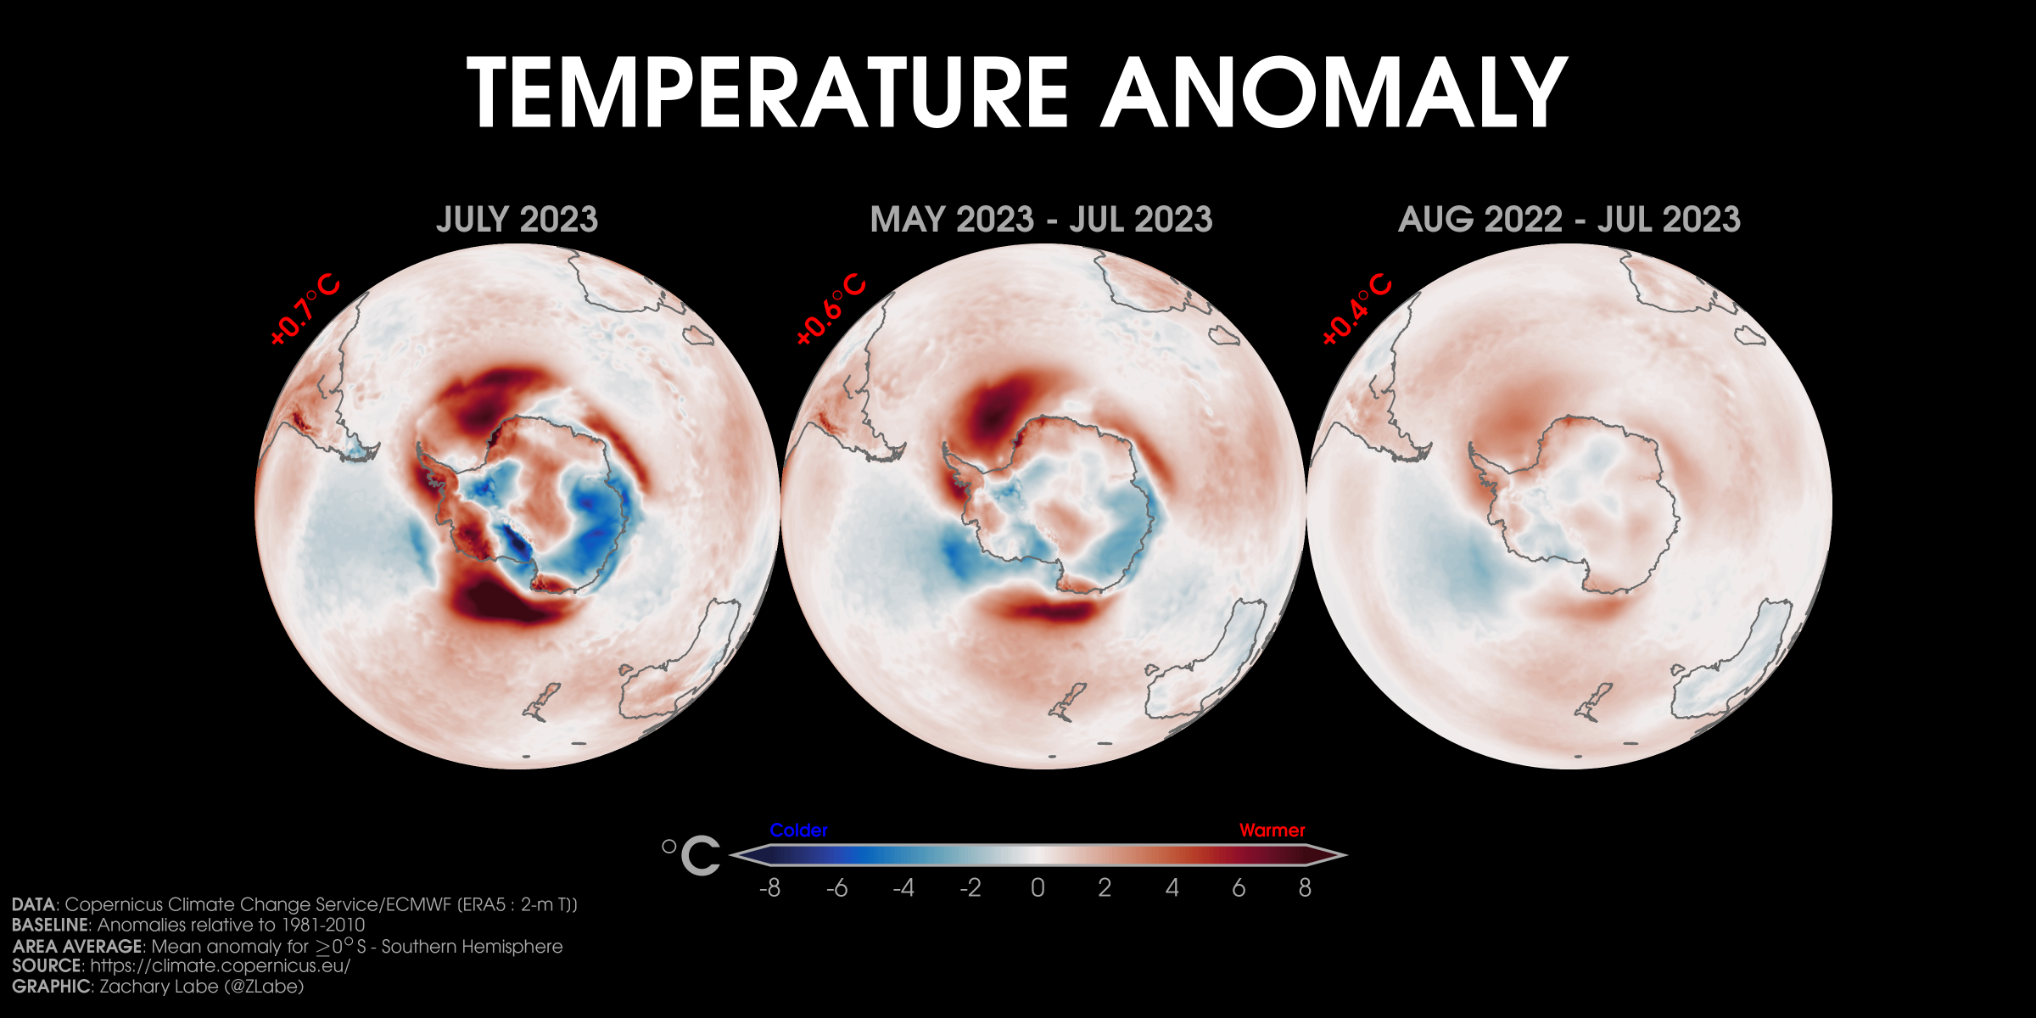
Temperature anomalies over the last month (left), 3 months (center), and 12 months (right) in the Southern Hemisphere... Departures exceed 8°C above the 1981-2010 average for parts of the Weddell and Ross Seas (related to lack of ice cover).
My #Arctic sea-ice thickness and volume graphics were just updated through July 2023: https://zacklabe.com/arctic-sea-ice-volumethickness/
Last month shattered the previous record for the hottest July global sea surface temperature on record 🥴
Data available from NOAA ERSSTv5 (https://psl.noaa.gov/data/gridded/data.noaa.ersst.v5.html).

The historic extreme event in the #Antarctic remarkably still continues...
Other sea ice visualizations: https://zacklabe.com/antarctic-sea-ice-extentconcentration/. More context: https://zacklabe.com/climate-viz-of-the-month/.
Data from https://nsidc.org/data/seaice_index

Last month observed anomalous warmth over the entire Greenland Ice Sheet...

#Arctic sea ice extent has now dropped below what used to be the average annual minimum in the 1990s (and 1980s). Again, the "melt season" typically ends in September.
+ Additional graphs: https://zacklabe.com/arctic-sea-ice-extentconcentration/
+ Small differences will exist between different datasets

nostr:npub1fh6lat3js6w5qs7dsakddvzecmdfz2np0mmy6zyufvfhac37z5qqayzu76 Is there a link to the Global Sea Surface Temps visualisation?
nostr:npub1dl8xsc6wae6d2pejmkfsz9h2ysvrq0x3mq6j56en02p4x7j7u27s5j4tsq In a few more days :)
Trends in #Arctic sea-ice concentration are much more widespread in August (and September) than during other months. The largest declines are in parts of the Chukchi and Beaufort Seas.
Sea ice concentration = fraction of ice-cover.
More information: https://journals.ametsoc.org/view/journals/bams/103/8/BAMS-D-22-0082.1.xml
Data from: https://nsidc.org/data/g02202/versions/4
