
A closer look at the extent of sea ice globally that just set a new all-time record minimum, which is due to unusually low sea ice conditions in both the #Arctic & #Antarctic right now.
Data from https://nsidc.org/data/seaice_index

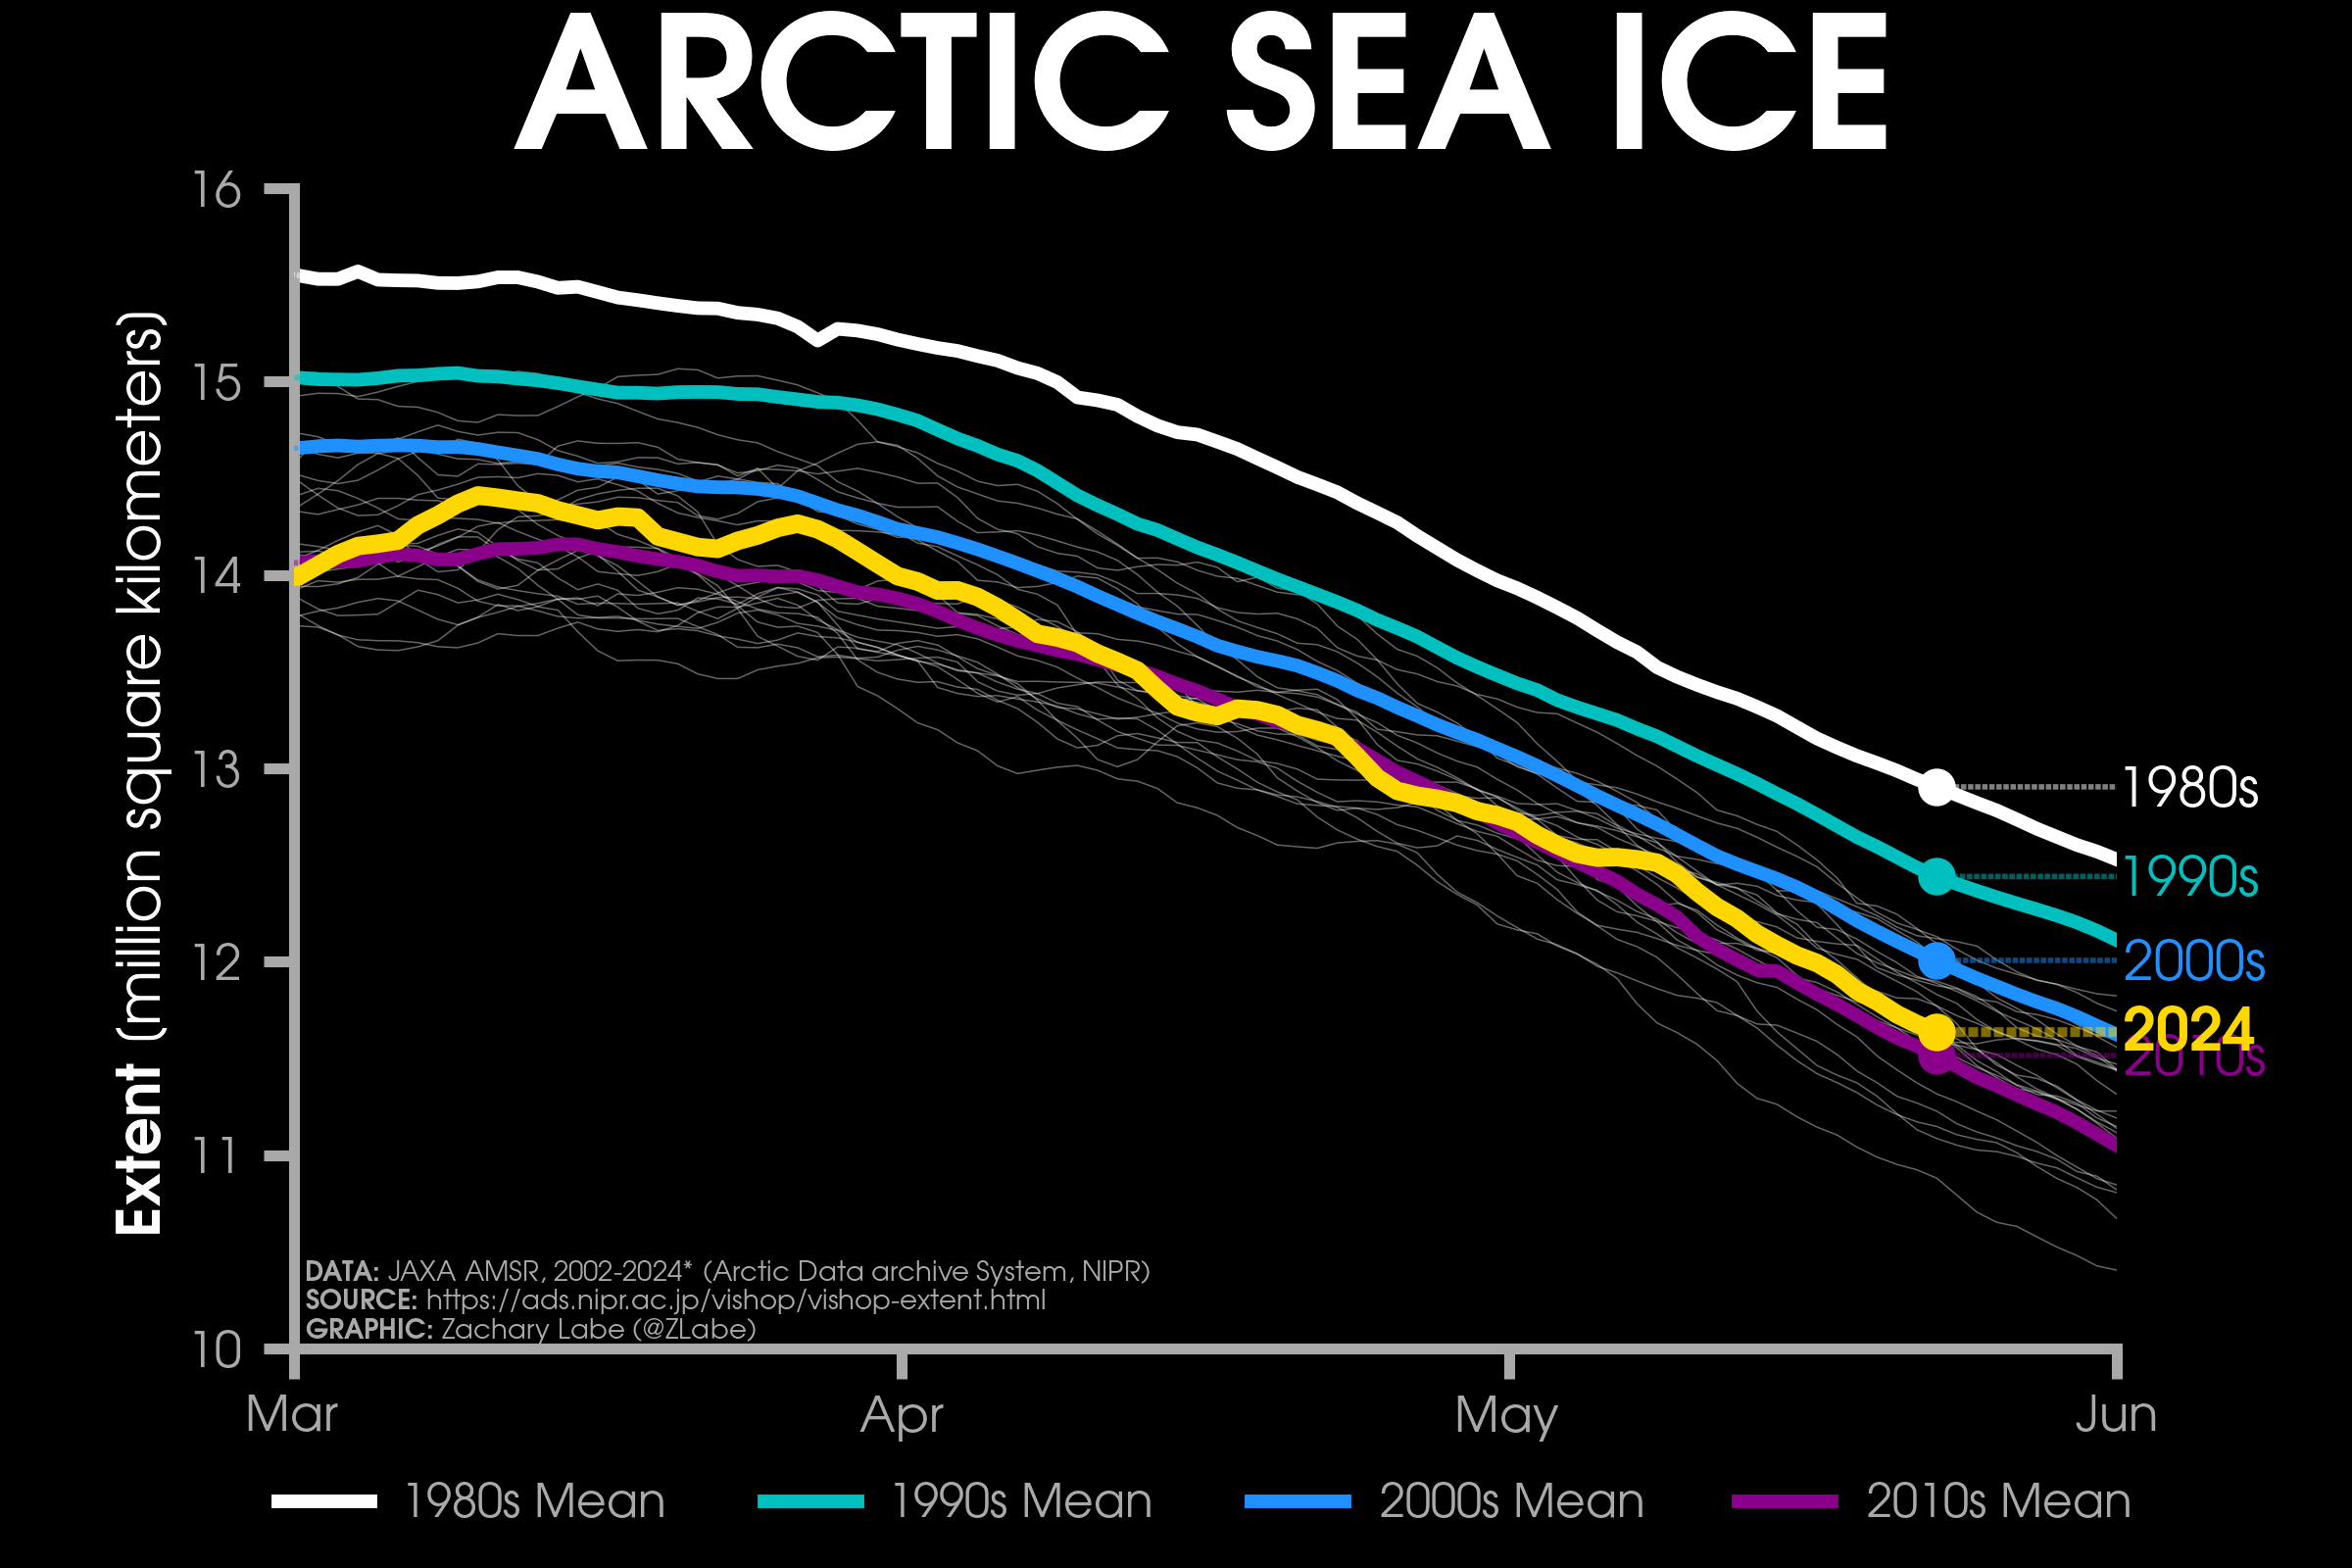
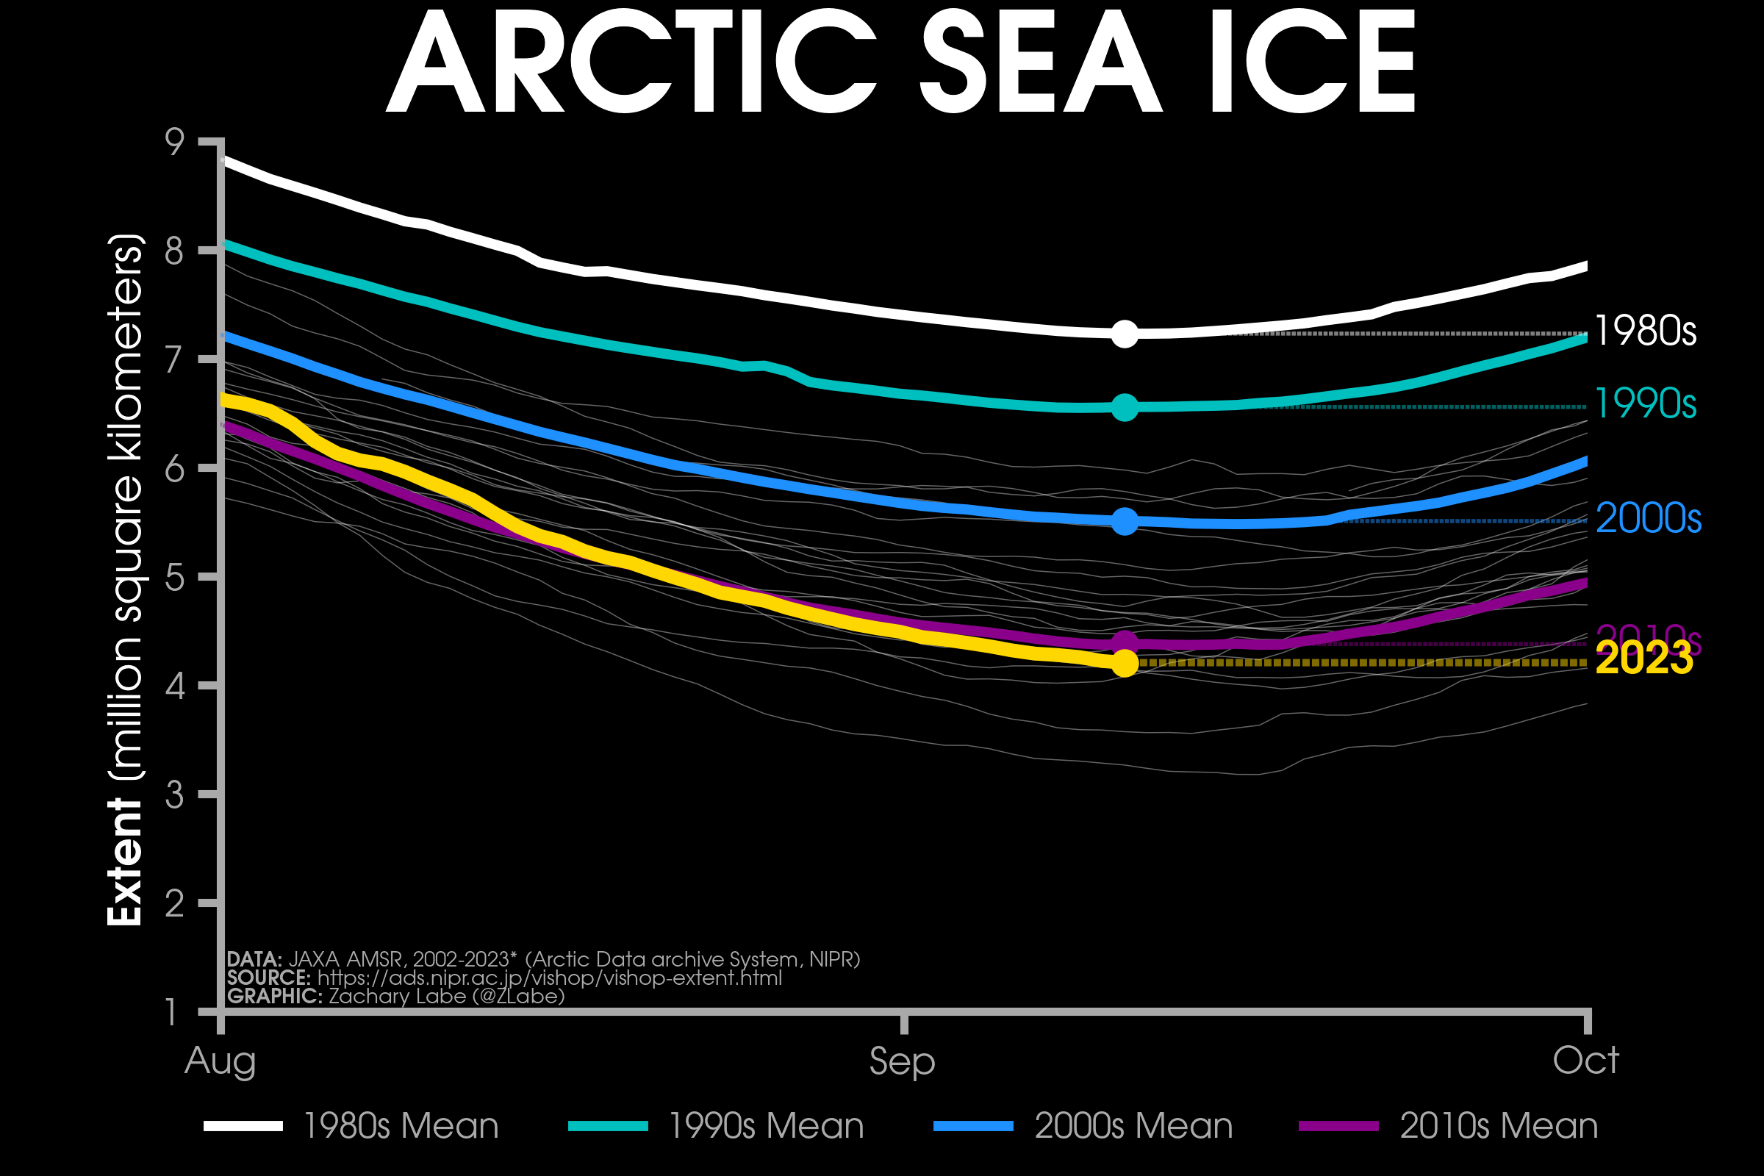
Happy Friday! Enjoy your weekend! Here's your latest ice update - #Arctic sea ice extent is currently the 10th lowest on record (JAXA data)...
• about 120,000 km² above the 2010s mean
• about 370,000 km² below the 2000s mean
• about 810,000 km² below the 1990s mean
• about 1,270,000 km² below the 1980s mean
Other plots: https://zacklabe.com/arctic-sea-ice-extentconcentration/
Trend in May temperatures across the #Arctic...
The largest warming is found in northern Siberia, especially stretching from the Lena River Delta to Severnaya Zemlya in the Laptev/Kara Seas.
Data from ECMWF ERA5. For more info: https://doi.org/10.1175/BAMS-D-23-0079.1

There were extremely large temperature anomalies in the highest latitudes of the Arctic in February 2024...
[Plot shows zonal-mean surface air temperature anomalies, where latitude = y-axis (not scaled by distance). Data: GISTEMPv4 using a 1951-1980 baseline]

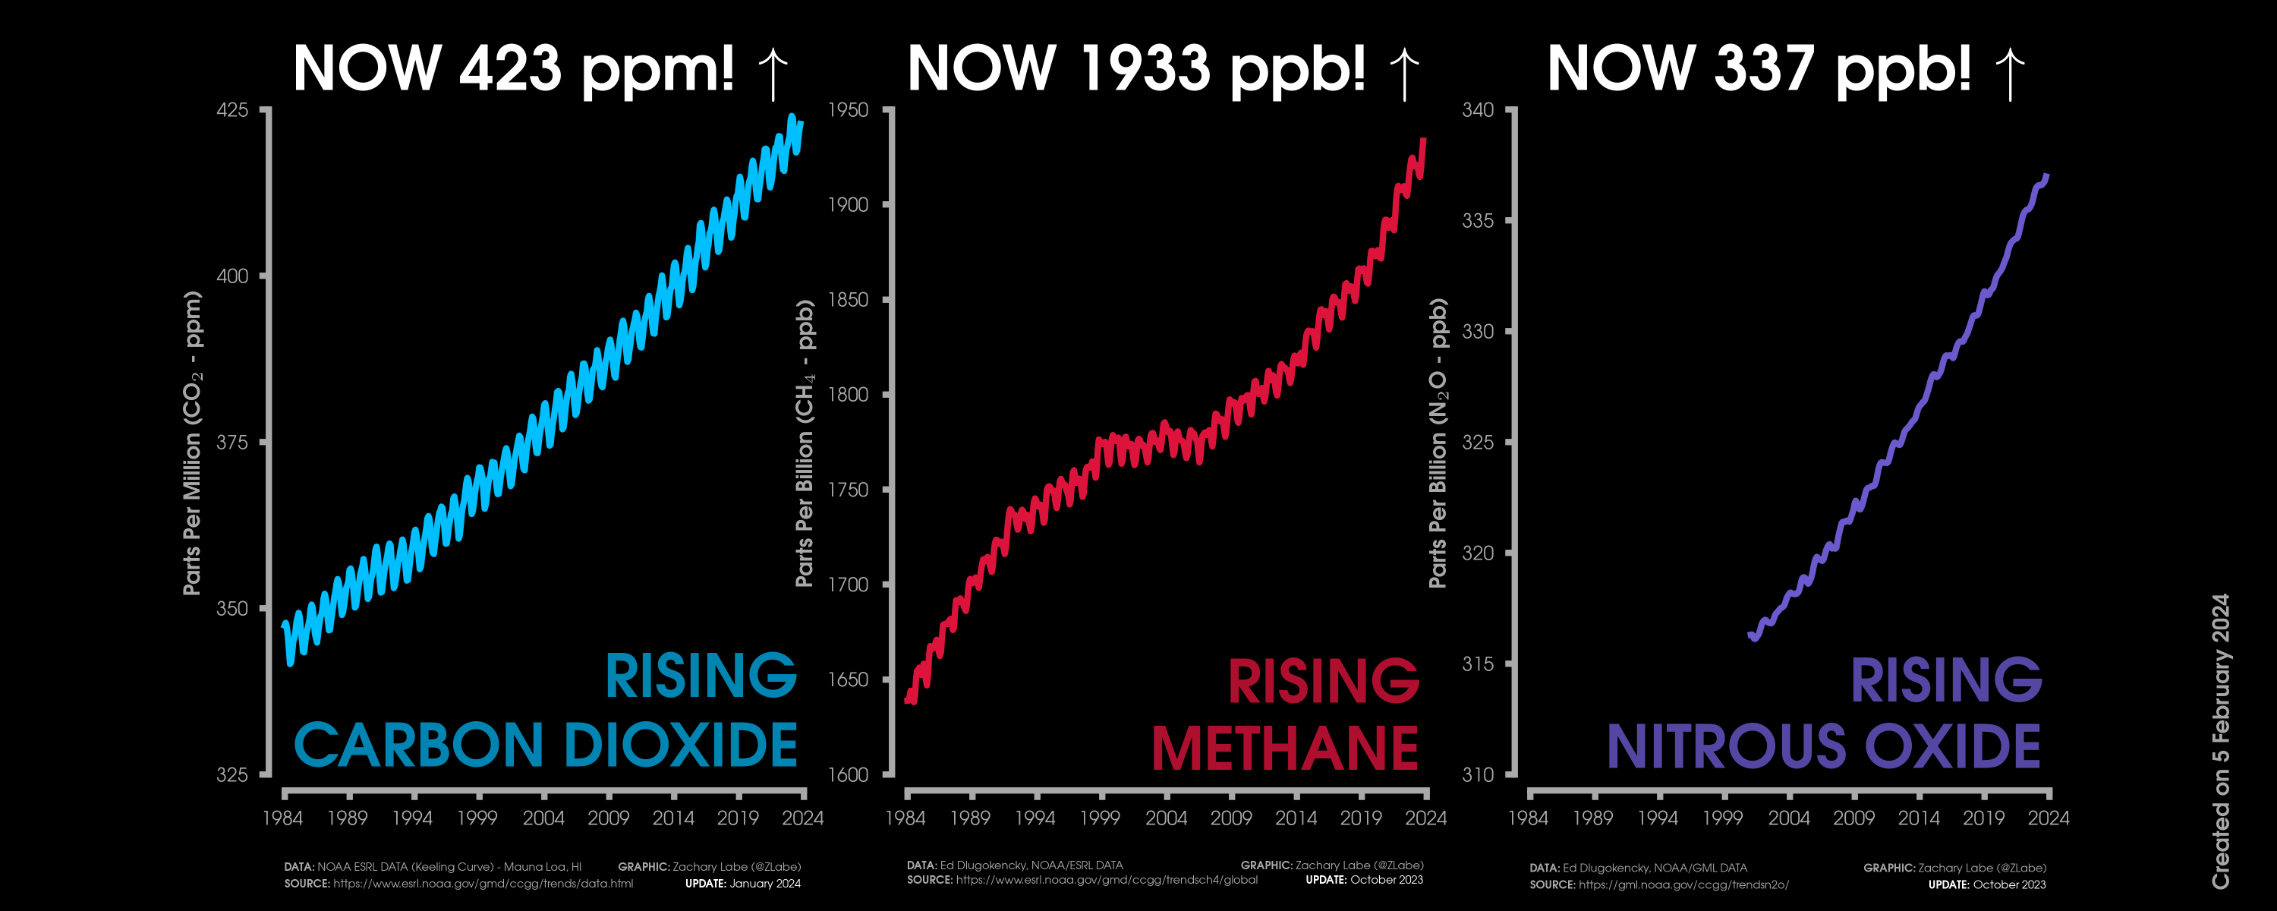
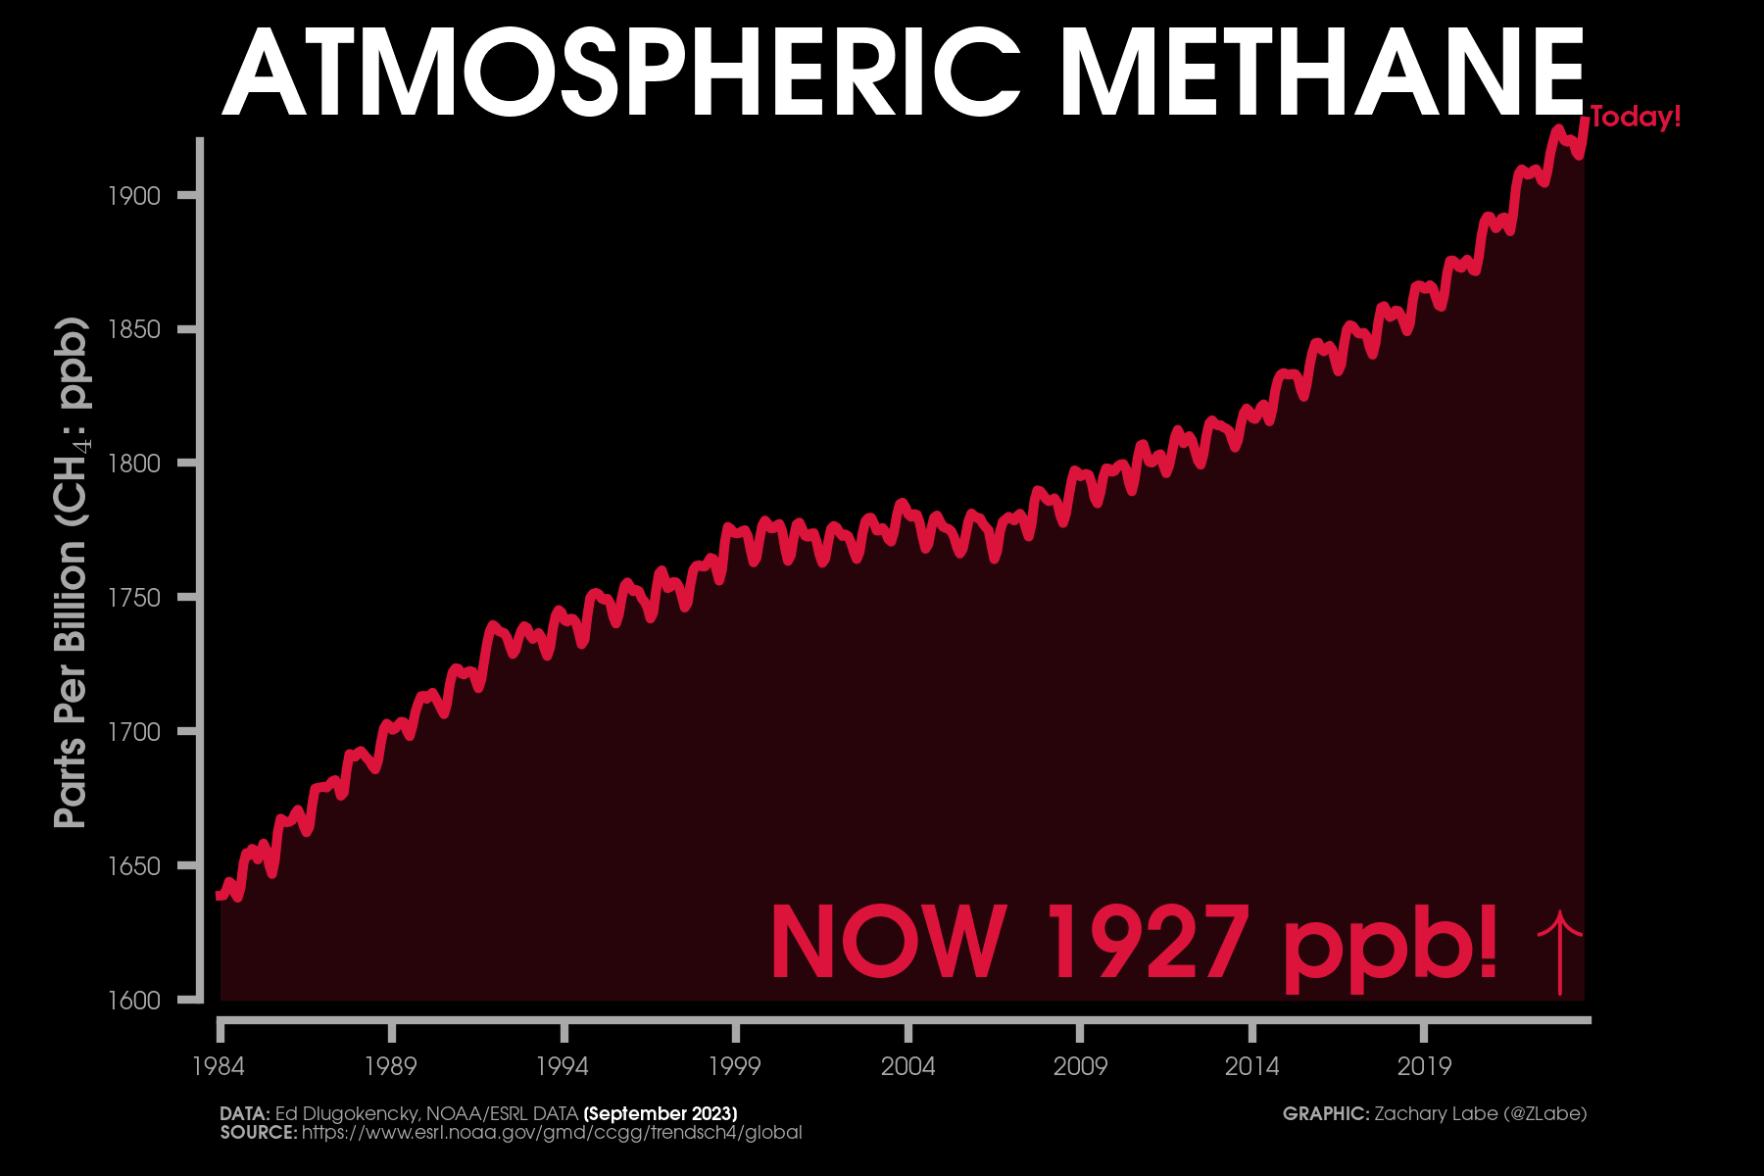
Another update for monthly mean greenhouse gases: carbon dioxide, methane (record high), and nitrous oxide (record high)...
Data from https://gml.noaa.gov/ccgg/trends/
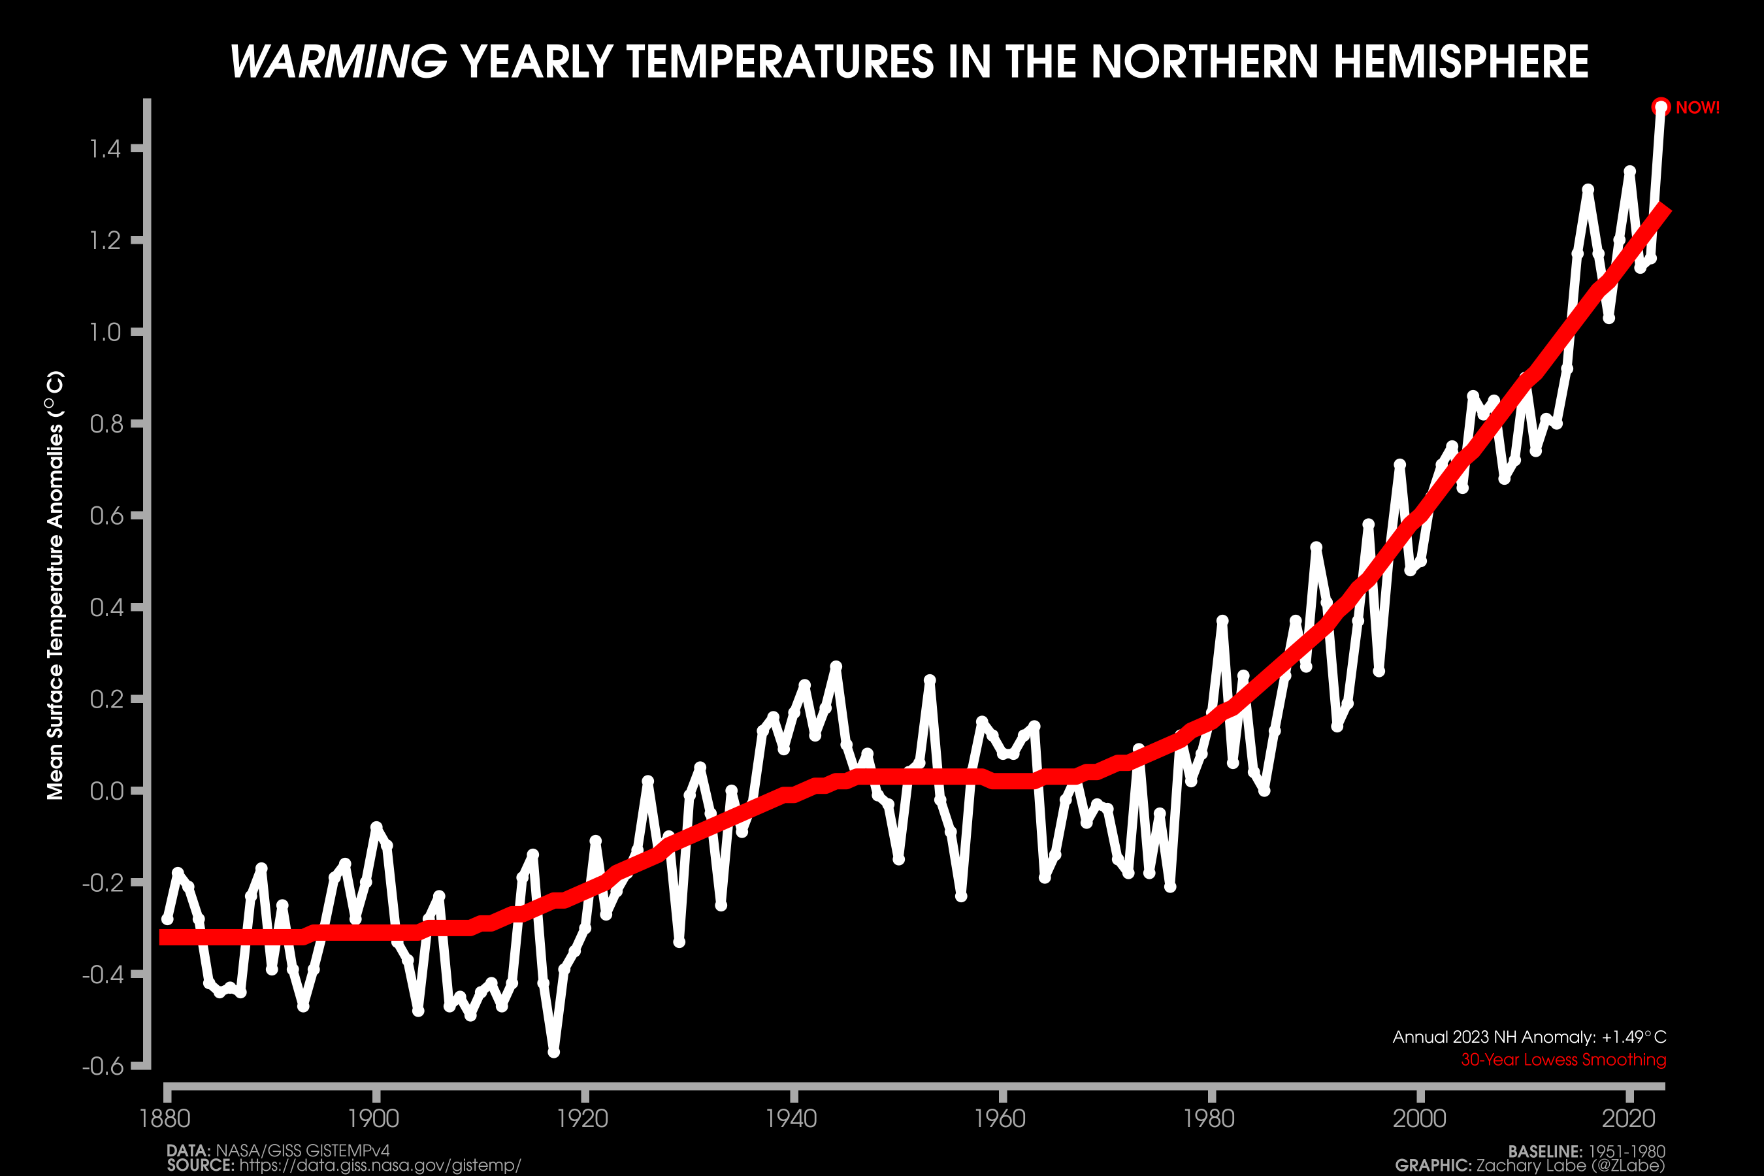
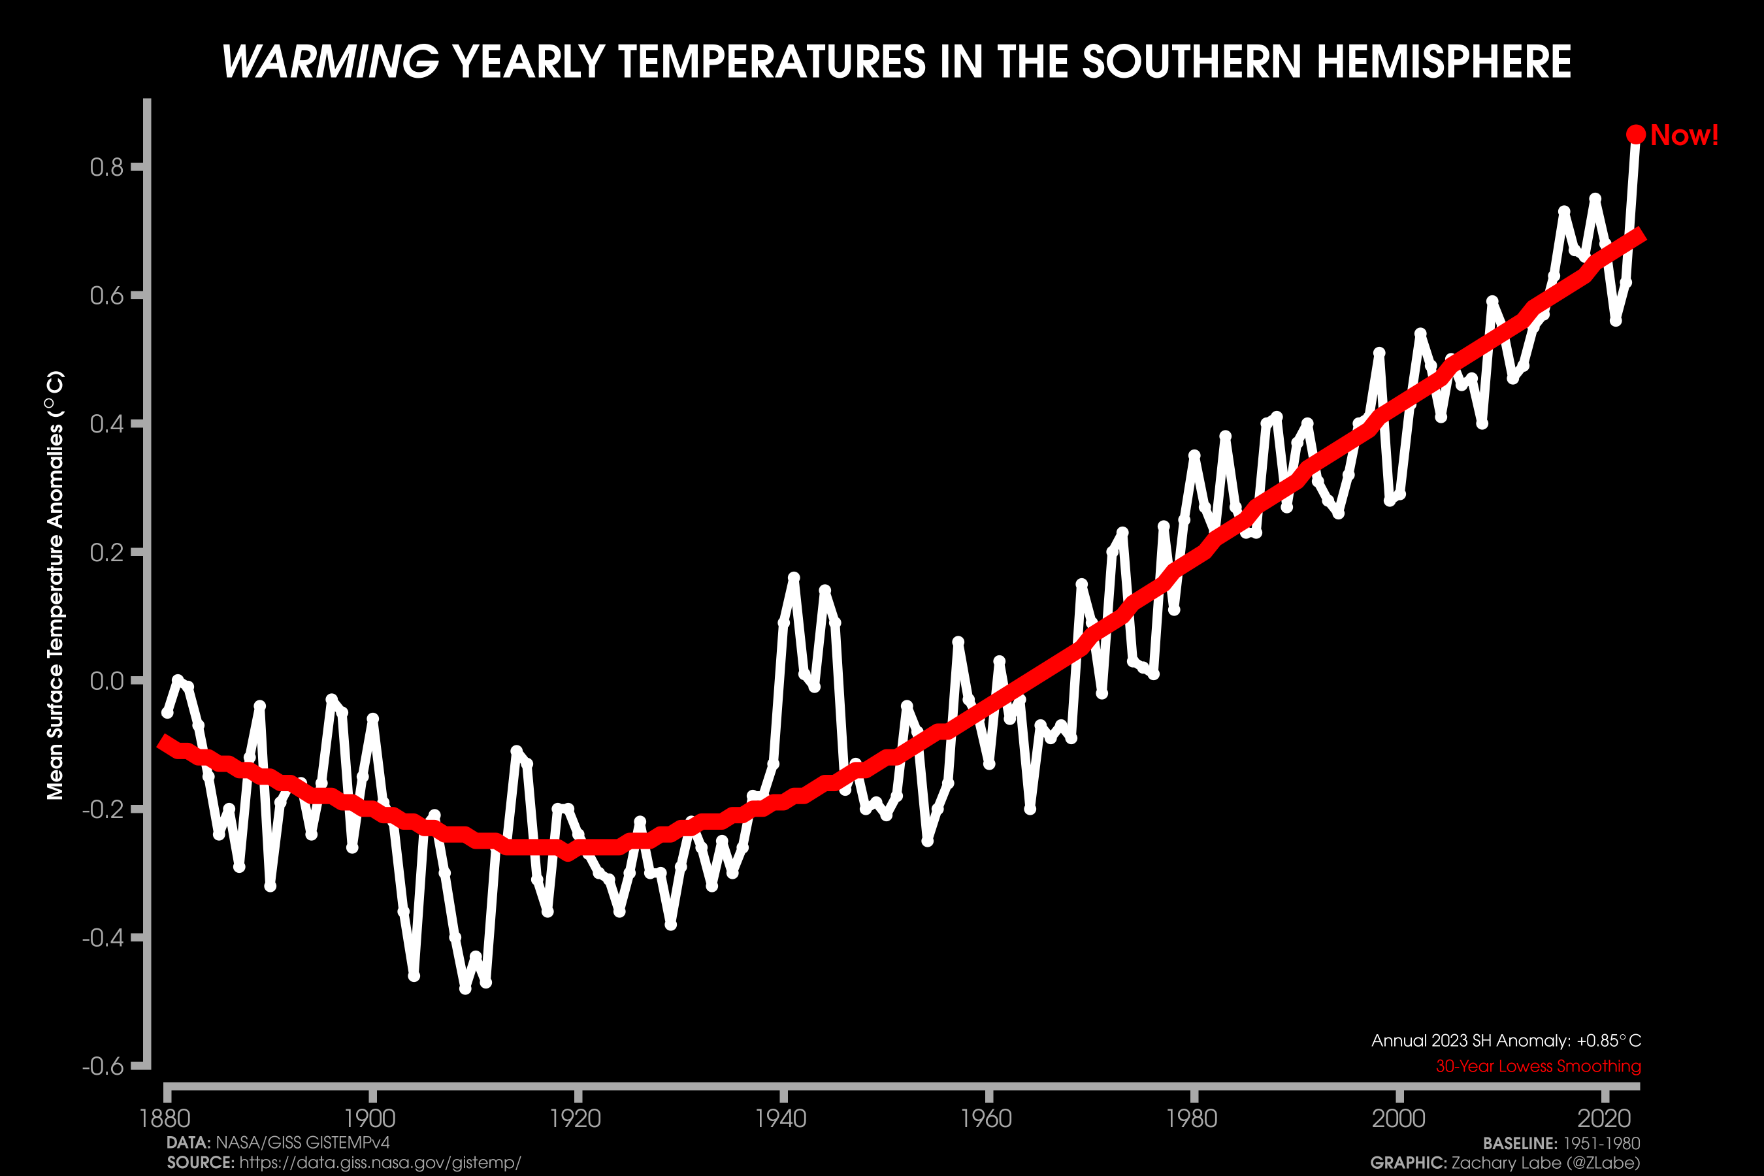
2023 was also clearly the warmest year on record when looking at each hemisphere separately.
[Data/methods: https://data.giss.nasa.gov/gistemp/faq/]
🚨 Methane (CH₄; potent greenhouse gas) reached a preliminary new record high value in September 2023 (1927.4 ppb).
September 2022's global methane abundance was 1915.4 ppb.
Note there is a seasonal cycle. Data available from https://esrl.noaa.gov/gmd/ccgg/trends_ch4/
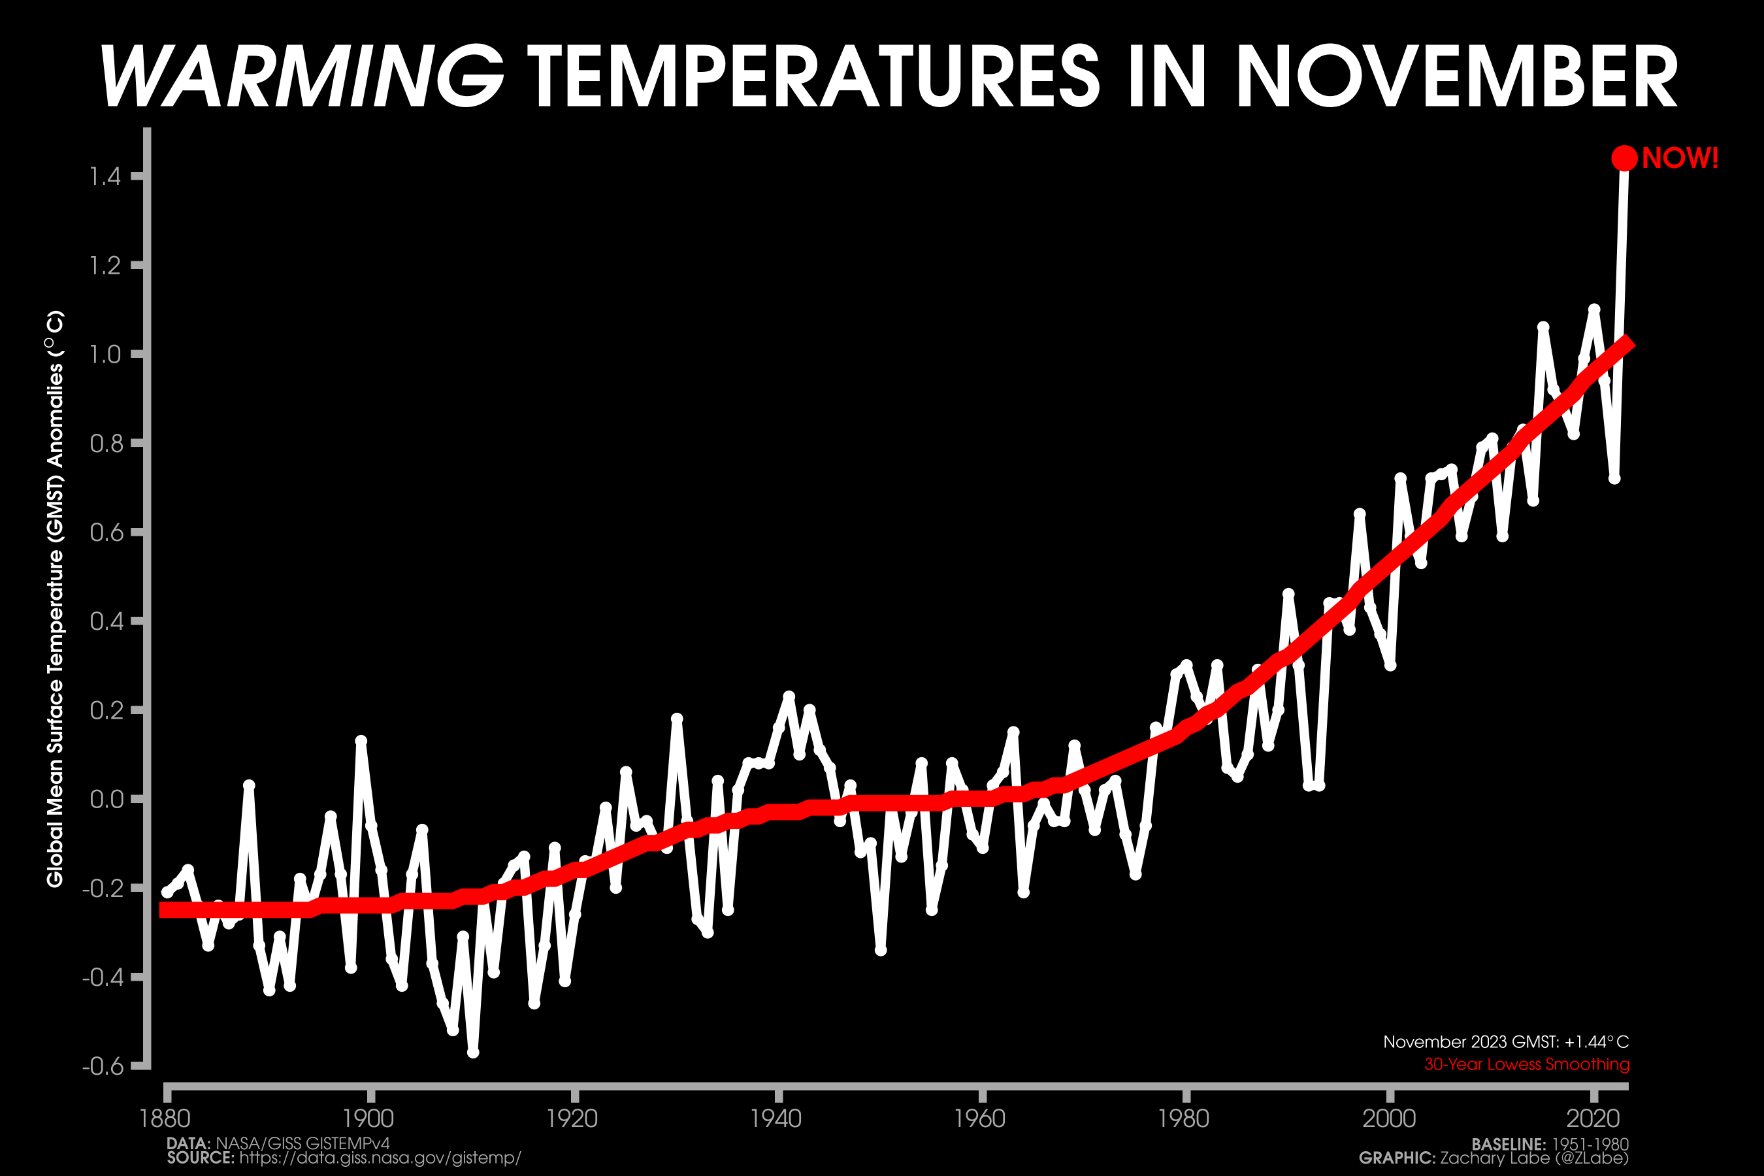
Is anyone actually surprised by this? Another new global temperature record for November 2023...
(Preliminary) NASA GISTEMPv4 data/info: https://data.giss.nasa.gov/gistemp/faq/
#Arctic air temperature rank by month over the satellite era - now updated through September 2023...
+ Ranks: 1=warmest (red), 44/45=coldest (blue)
+ Download visual: https://zacklabe.com/arctic-temperatures/
+ Data from https://psl.noaa.gov/data/gridded/data.ncep.reanalysis.html

100 years of June-July-August temperature anomalies over land through 2023. It's going to get hotter.
Data from https://data.giss.nasa.gov/gistemp/
I've contributed a page on PIOMAS to the NCAR Climate Data Guide - check it out at https://climatedataguide.ucar.edu/climate-data/pan-arctic-ice-ocean-modeling-and-assimilation-system-piomas #SciComm #OpenScience #OpenData
Good morning! Have a great week! Here's your Monday ice update - #Arctic sea ice extent is currently the 6th lowest on record (JAXA data)...
• about 170,000 km² below the 2010s mean
• about 1,300,000 km² below the 2000s mean
• about 2,350,000 km² below the 1990s mean
• about 3,030,000 km² below the 1980s mean
Other plots: https://zacklabe.com/arctic-sea-ice-figures/
August observed a similar distribution of #Antarctic sea ice anomalies as the last few months. Most areas remained well below average, except for the Amundsen Sea. Extent was a record low.
Data from https://nsidc.org/data/g02202/versions/4. Concentration = fraction of sea ice in a location.

nostr:npub1kud3a6w4jtmzsugek9s9z57vdwyrvdyj05jvz28ktpfdnnhlracqxyd7e8 Only in this region, yes.
Good morning and happy Friday! Here's your ice update - #Arctic sea ice extent is currently the 7th lowest on record (JAXA data)...
• about 80,000 km² below the 2010s mean
• about 1,180,000 km² below the 2000s mean
• about 2,190,000 km² below the 1990s mean
• about 2,910,000 km² below the 1980s mean
Additional visualizations: https://zacklabe.com/arctic-sea-ice-extentconcentration/

nostr:npub1fh6lat3js6w5qs7dsakddvzecmdfz2np0mmy6zyufvfhac37z5qqayzu76
ok. honestly, if someone showed me this picture without comment, I would have thought so much ice/snow is there in summer in Arctic even now. so, this is very low? then what was before? compare and contrast would be useful here in my view.
nostr:npub1e8nmdntlhulxzqt2zlstty0myuusskhds5v5ad0shzv5hmjyxq4snuclar You can compare that here: 
Temperature anomalies over the last month (left), 3 months (center), and 12 months (right) in the Northern Hemisphere...
Data from ECMWF ERA5 reanalysis at https://cds.climate.copernicus.eu/cdsapp#!/dataset/reanalysis-era5-single-levels-monthly-means?tab=overview

nostr:npub17v4nltnmyrapy8c8av6d74vcv6f440ccw8pmsdcuae3t8v2r6v6smyyr7p The data was not lost. There is a lack of long-term in situ station data in polar regions. Even now, there is a little science funding to support observations in these areas (https://www.theguardian.com/world/2023/aug/19/scientists-lament-southern-ocean-data-desert-just-as-climate-crisis-brings-frightening-changes).