#LTCBTC doesn’t get a lot of attention, but it gives us a lot of data.
The black vertical lines are the times when #Bitcoin and #Litecoin peaked. We’re not close to the duration of previous cycles, not until between October to May.
There is also a Fair Value Gap to be filled. If #LTC breaks to the upside, against #BTC , then it should at least fill that gap. 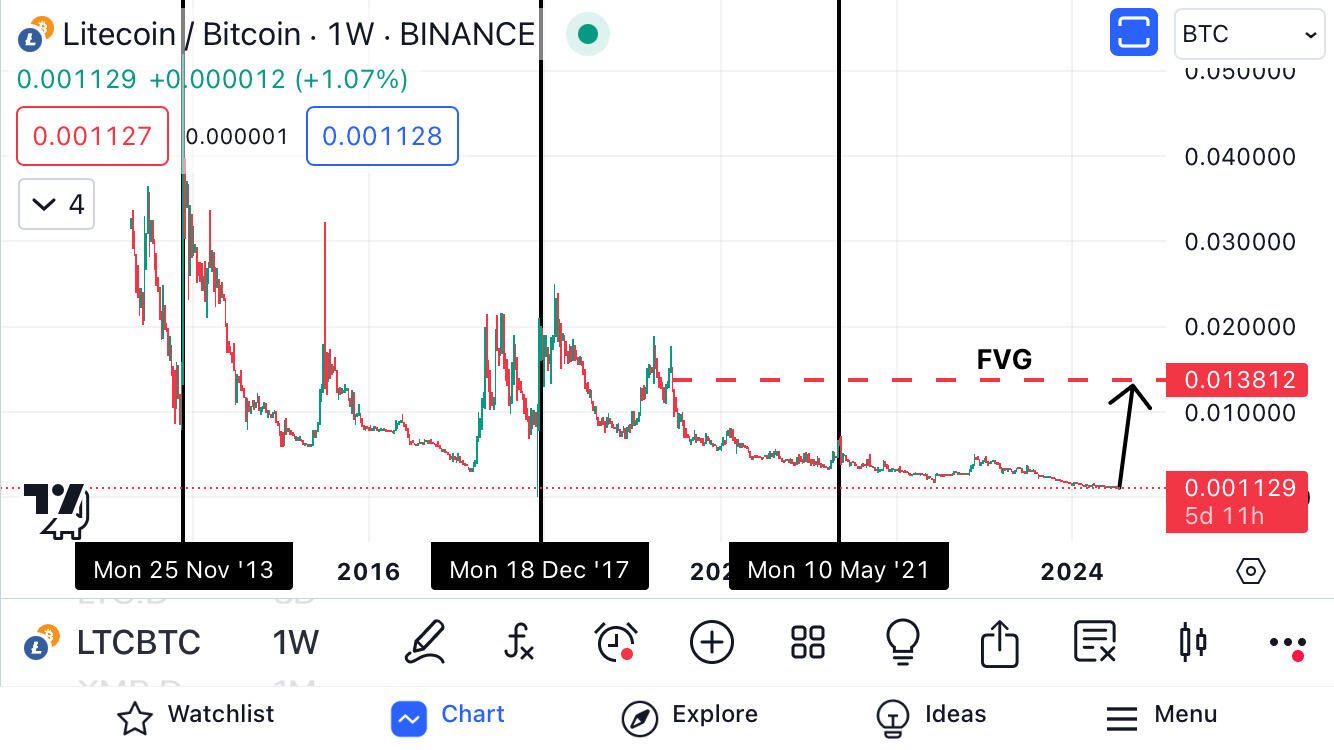
How would you have traded the #SPX during the double dip recession?
Just like with #Bitcoin, the #SPY broke range lows… it has been up only since.
RSI also made a higher low, but the overall trend was up. Not shown is the hidden bullish divergence. #BTC 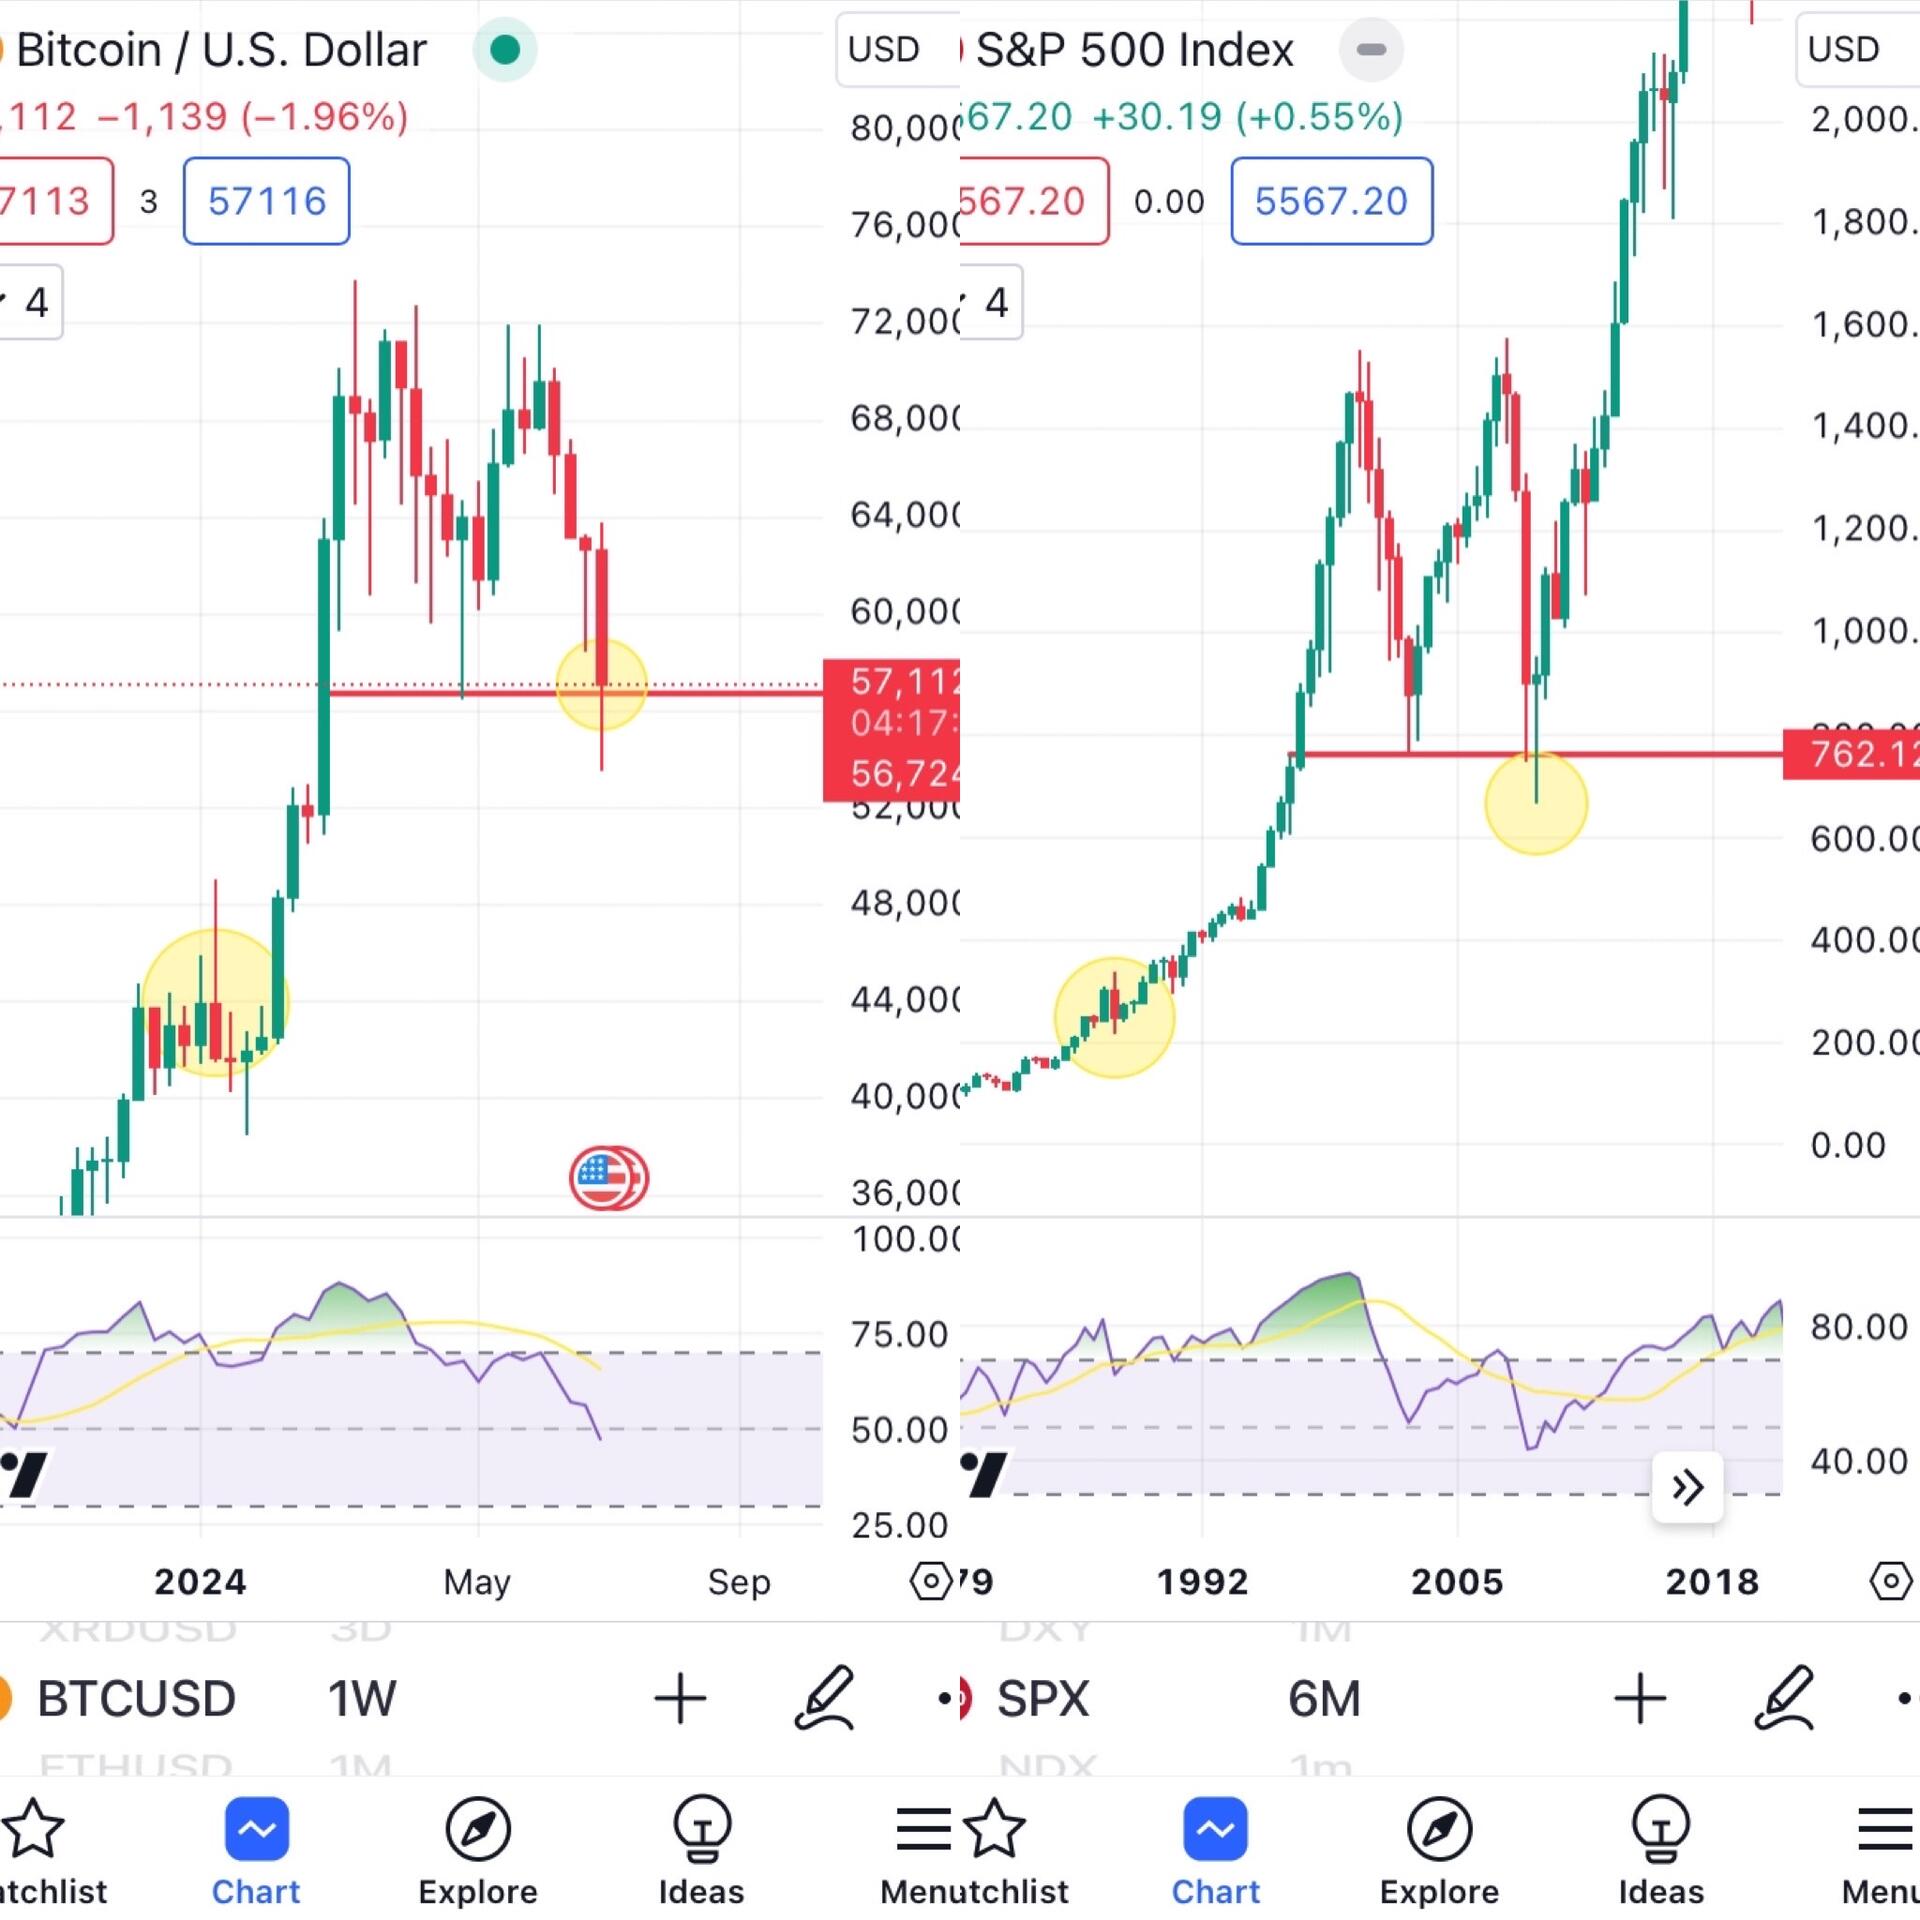
It has been 38 months since the #crypto 2021 peak.
By this time, during the 2021 bull run, #Bitcoin would’ve already went parabolic, and #altcoins would’ve been catching up.
However, consider the 2017 bull run. We can use #LTC as an example, as it has the same peaks as #BTC, yet represents an #alt. By 38 months, altcoins were still depressed.
I think this cycle will take longer than we expect. 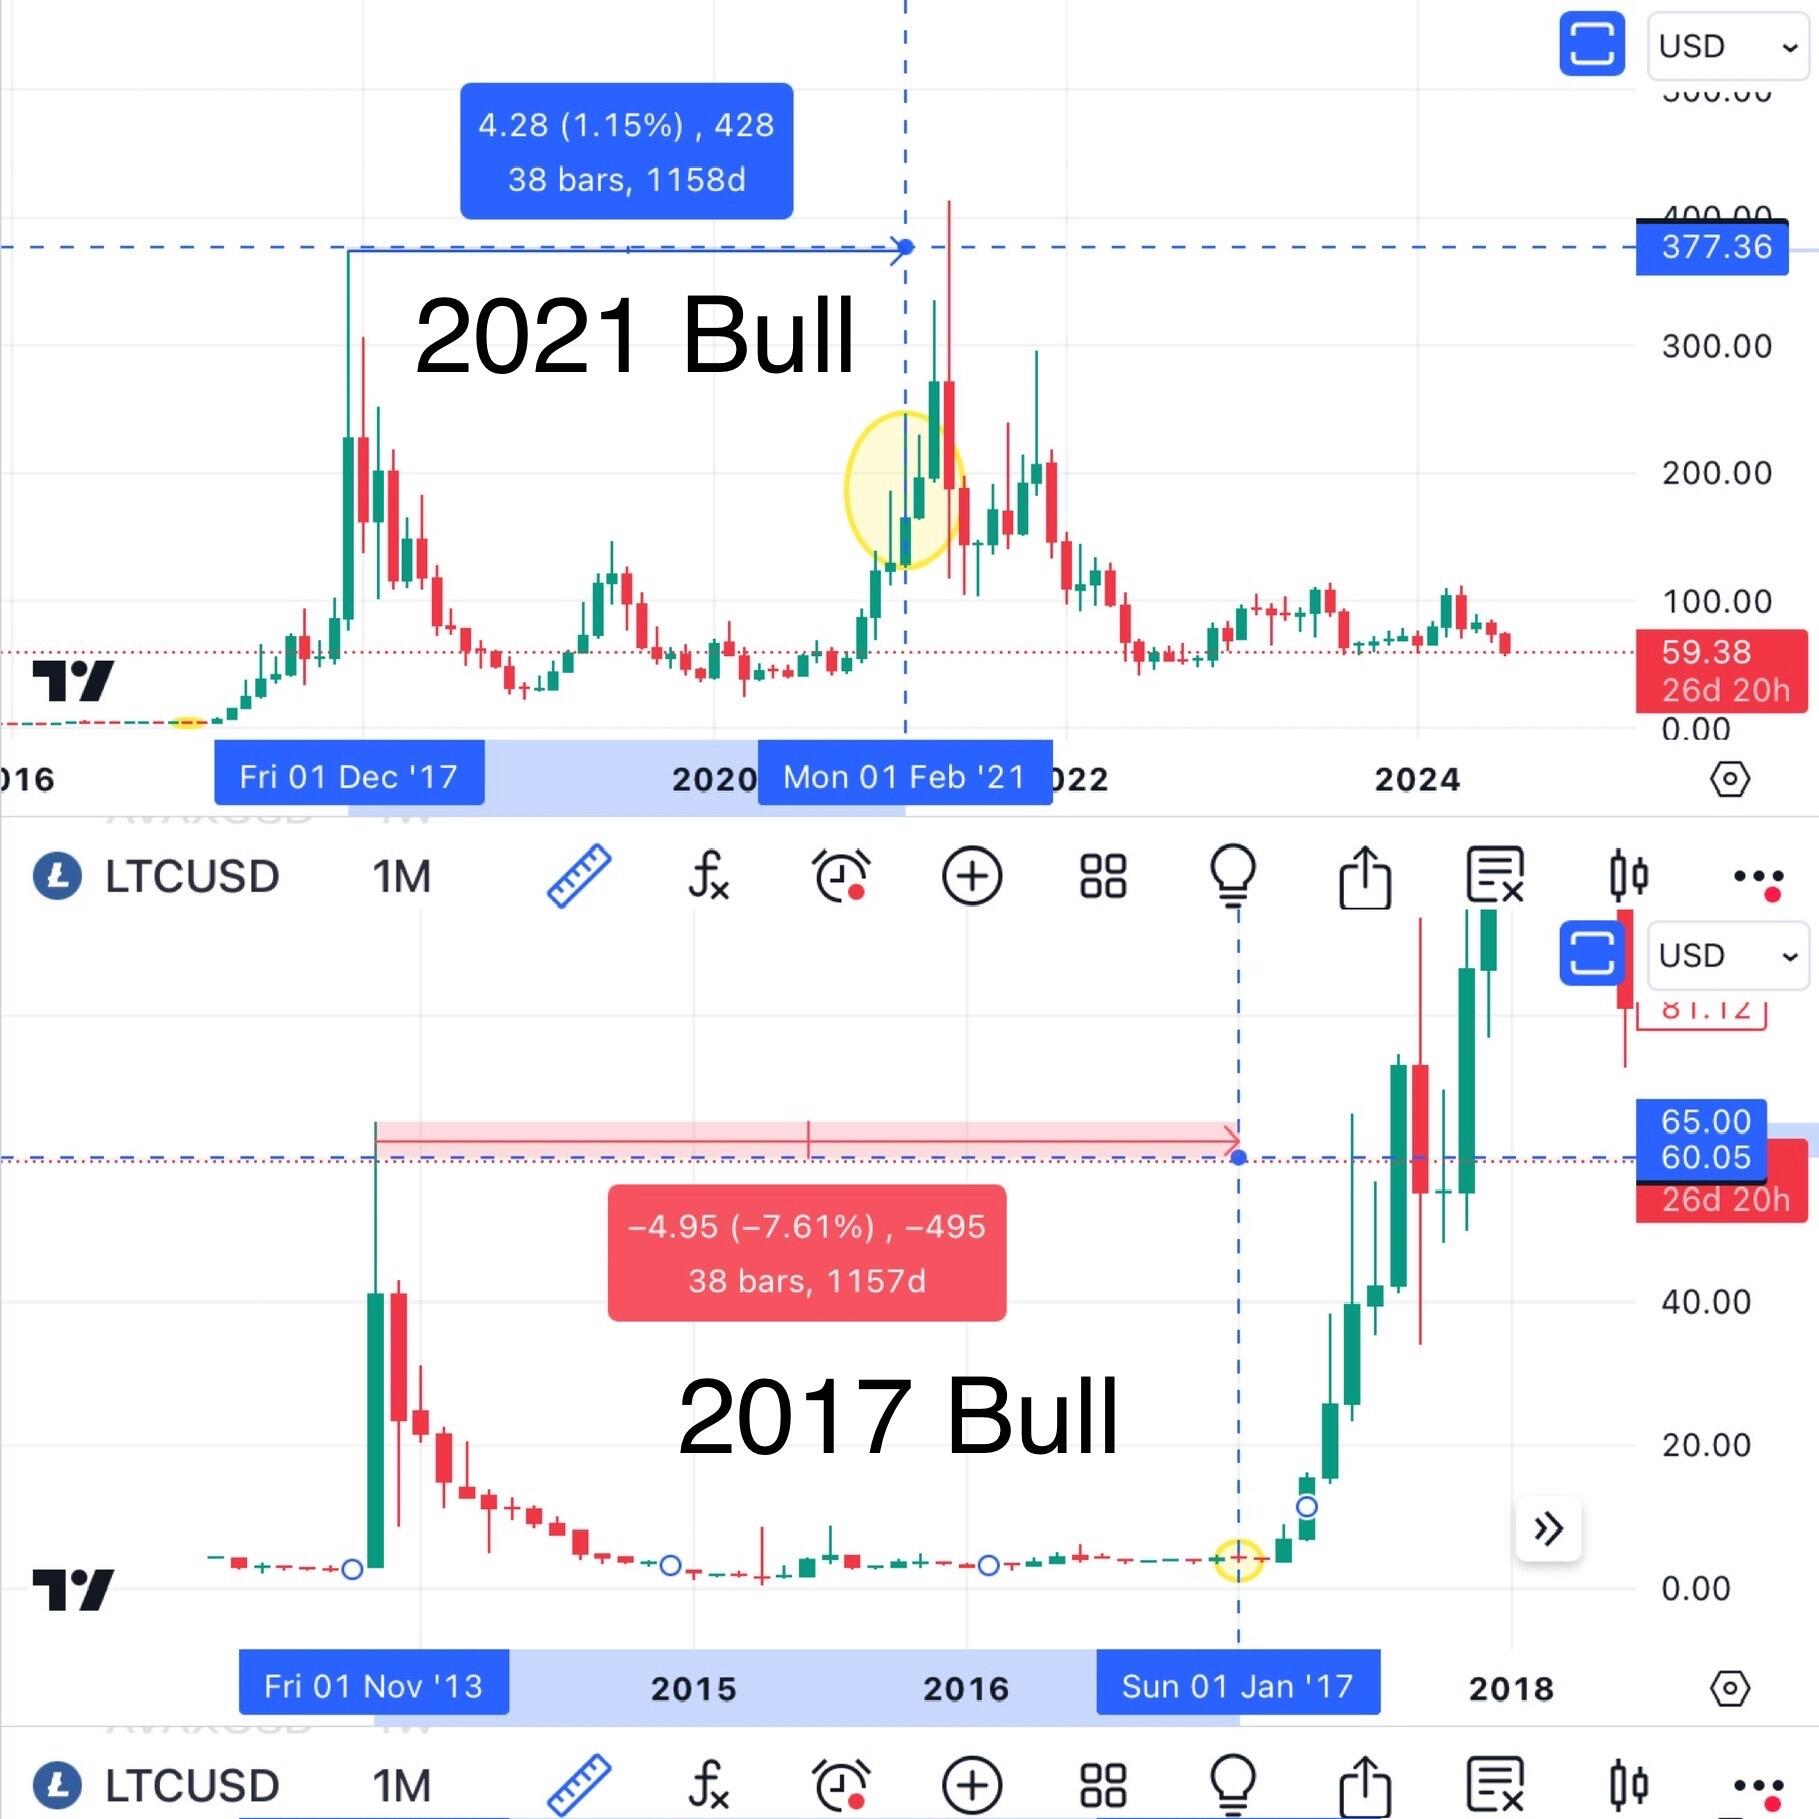
It took #Bitcoin 35 months to get back to the ATH, since the April 2021 peak.
It took #BTC 35 months to get back to the ATH during the 2021 bull run, peaking at month 40.
$BTC just started its 39th month, and we’re still rangebound at the previous ATH. What gives?!
Consider this. During the 2017 bull run, it took Bitcoin 39 months to get back to the previous ATH, peaking at month 49.
Just because Bitcoin hasn’t gone parabolic yet is not out of the ordinary. It may take even another 10 months to peak, just like in the 2017 bull run. 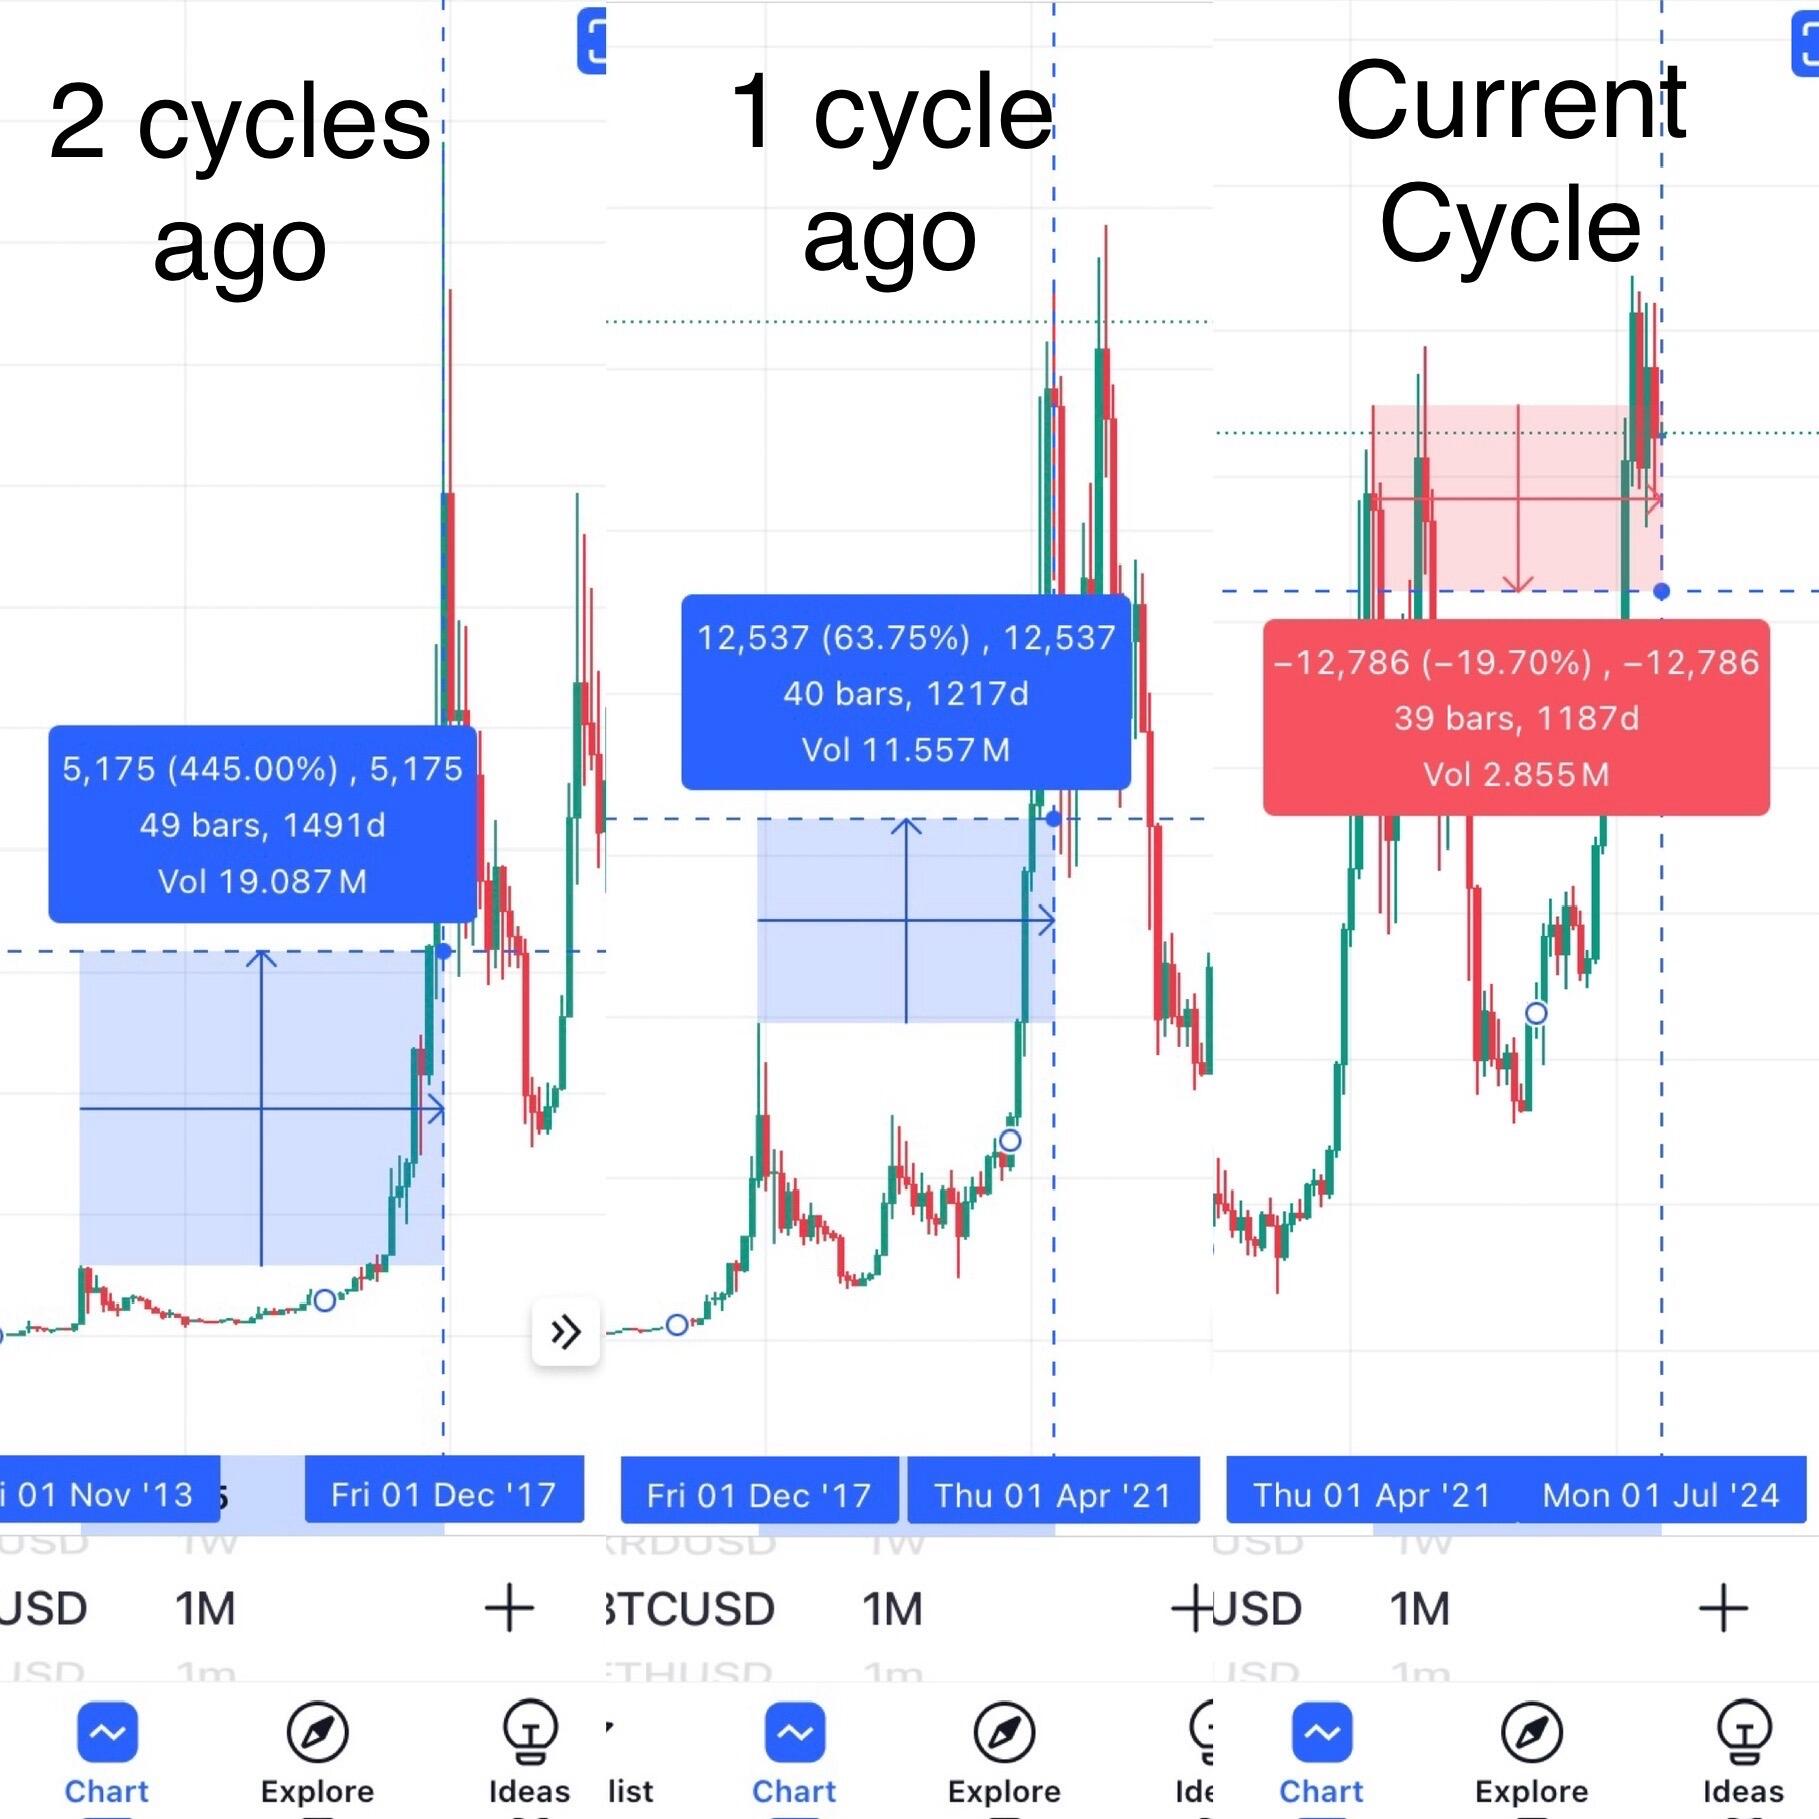
#Bitcoin looks to be retesting that Bull Market Support Band… again!
#BTC RSI is making a lower low, but price is making a lower high. This is considered hidden bullish divergence. 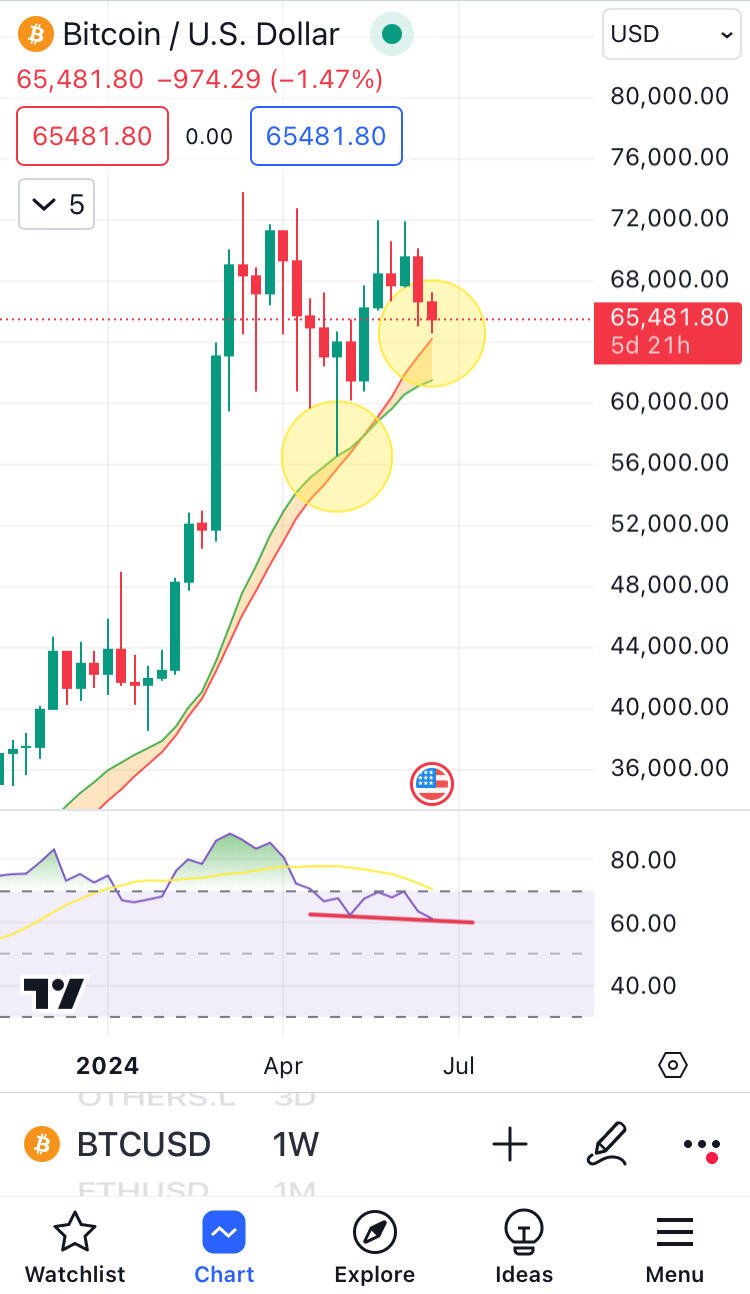
“Sell in May, and go away.” This has been true if you were investing in $BTC and #Crypto for the past 3 consecutive years.
The last time #Bitcoin had a green May was in 2020. In the following 11 months, #BTC rose 700%+.
This past May was green, with Bitcoin up 20%.
I’m staying cautiously optimistic, but… C’mon June, to the MOON 🌙!!!
There’s only a handful of active coins created prior to 2015… #BTC, #LTC, #XRP, #DOGE to name a few.
From peak to peak of their cycles, it was between 40-50 months. We’re at 36 months since the technical peak of the last cycle.
If the peak of this #crypto cycle is coming up, that would mean we’ll see it between September 2024 - July 2025. Get ready.
In 2021, this was the order of rips and dips between $GME, $AMC, and $BTC:
1. #GME ripped, while #BTC was in a dip.
2. #Bitcoin ripped, while #Gamestop was dipping.
3. Bitcoin dipped, then #AMC ripped.
Not saying history will repeat itself, but it’s interesting to note that GME and AMC are ripping, while BTC is in a dip. 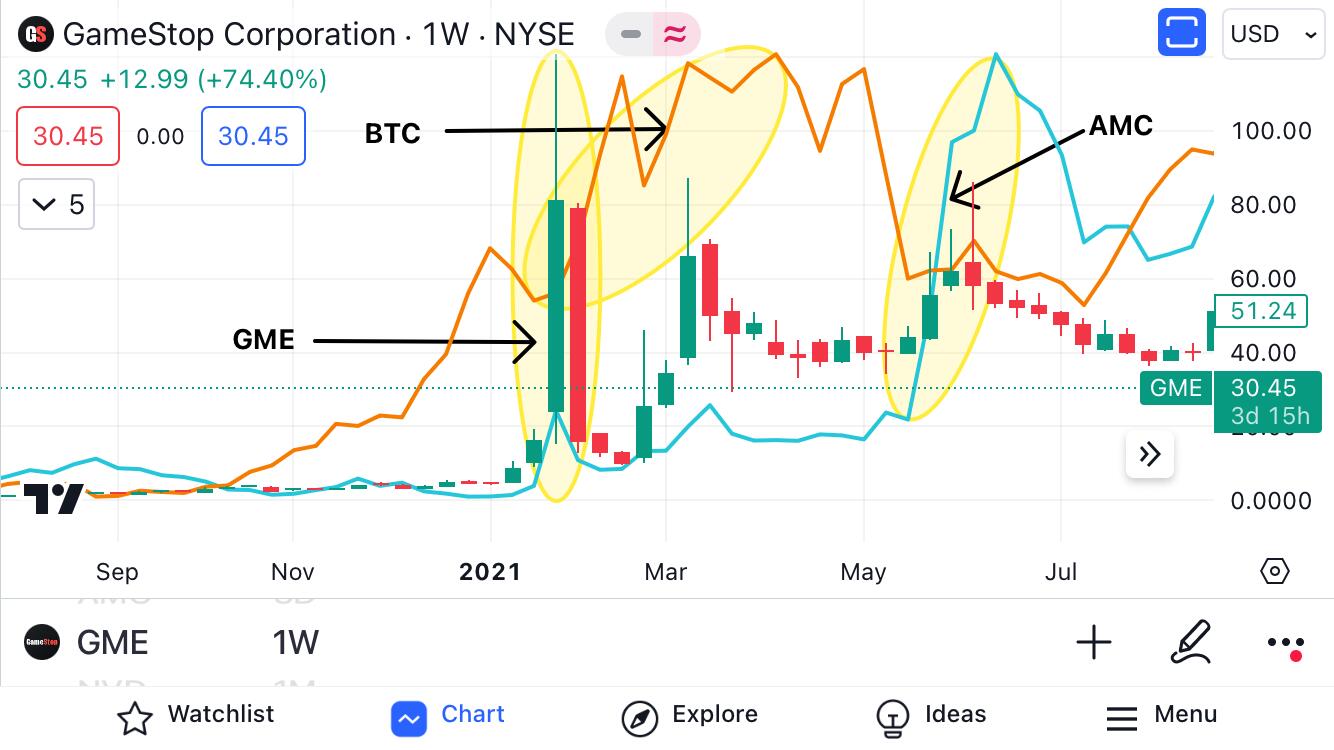
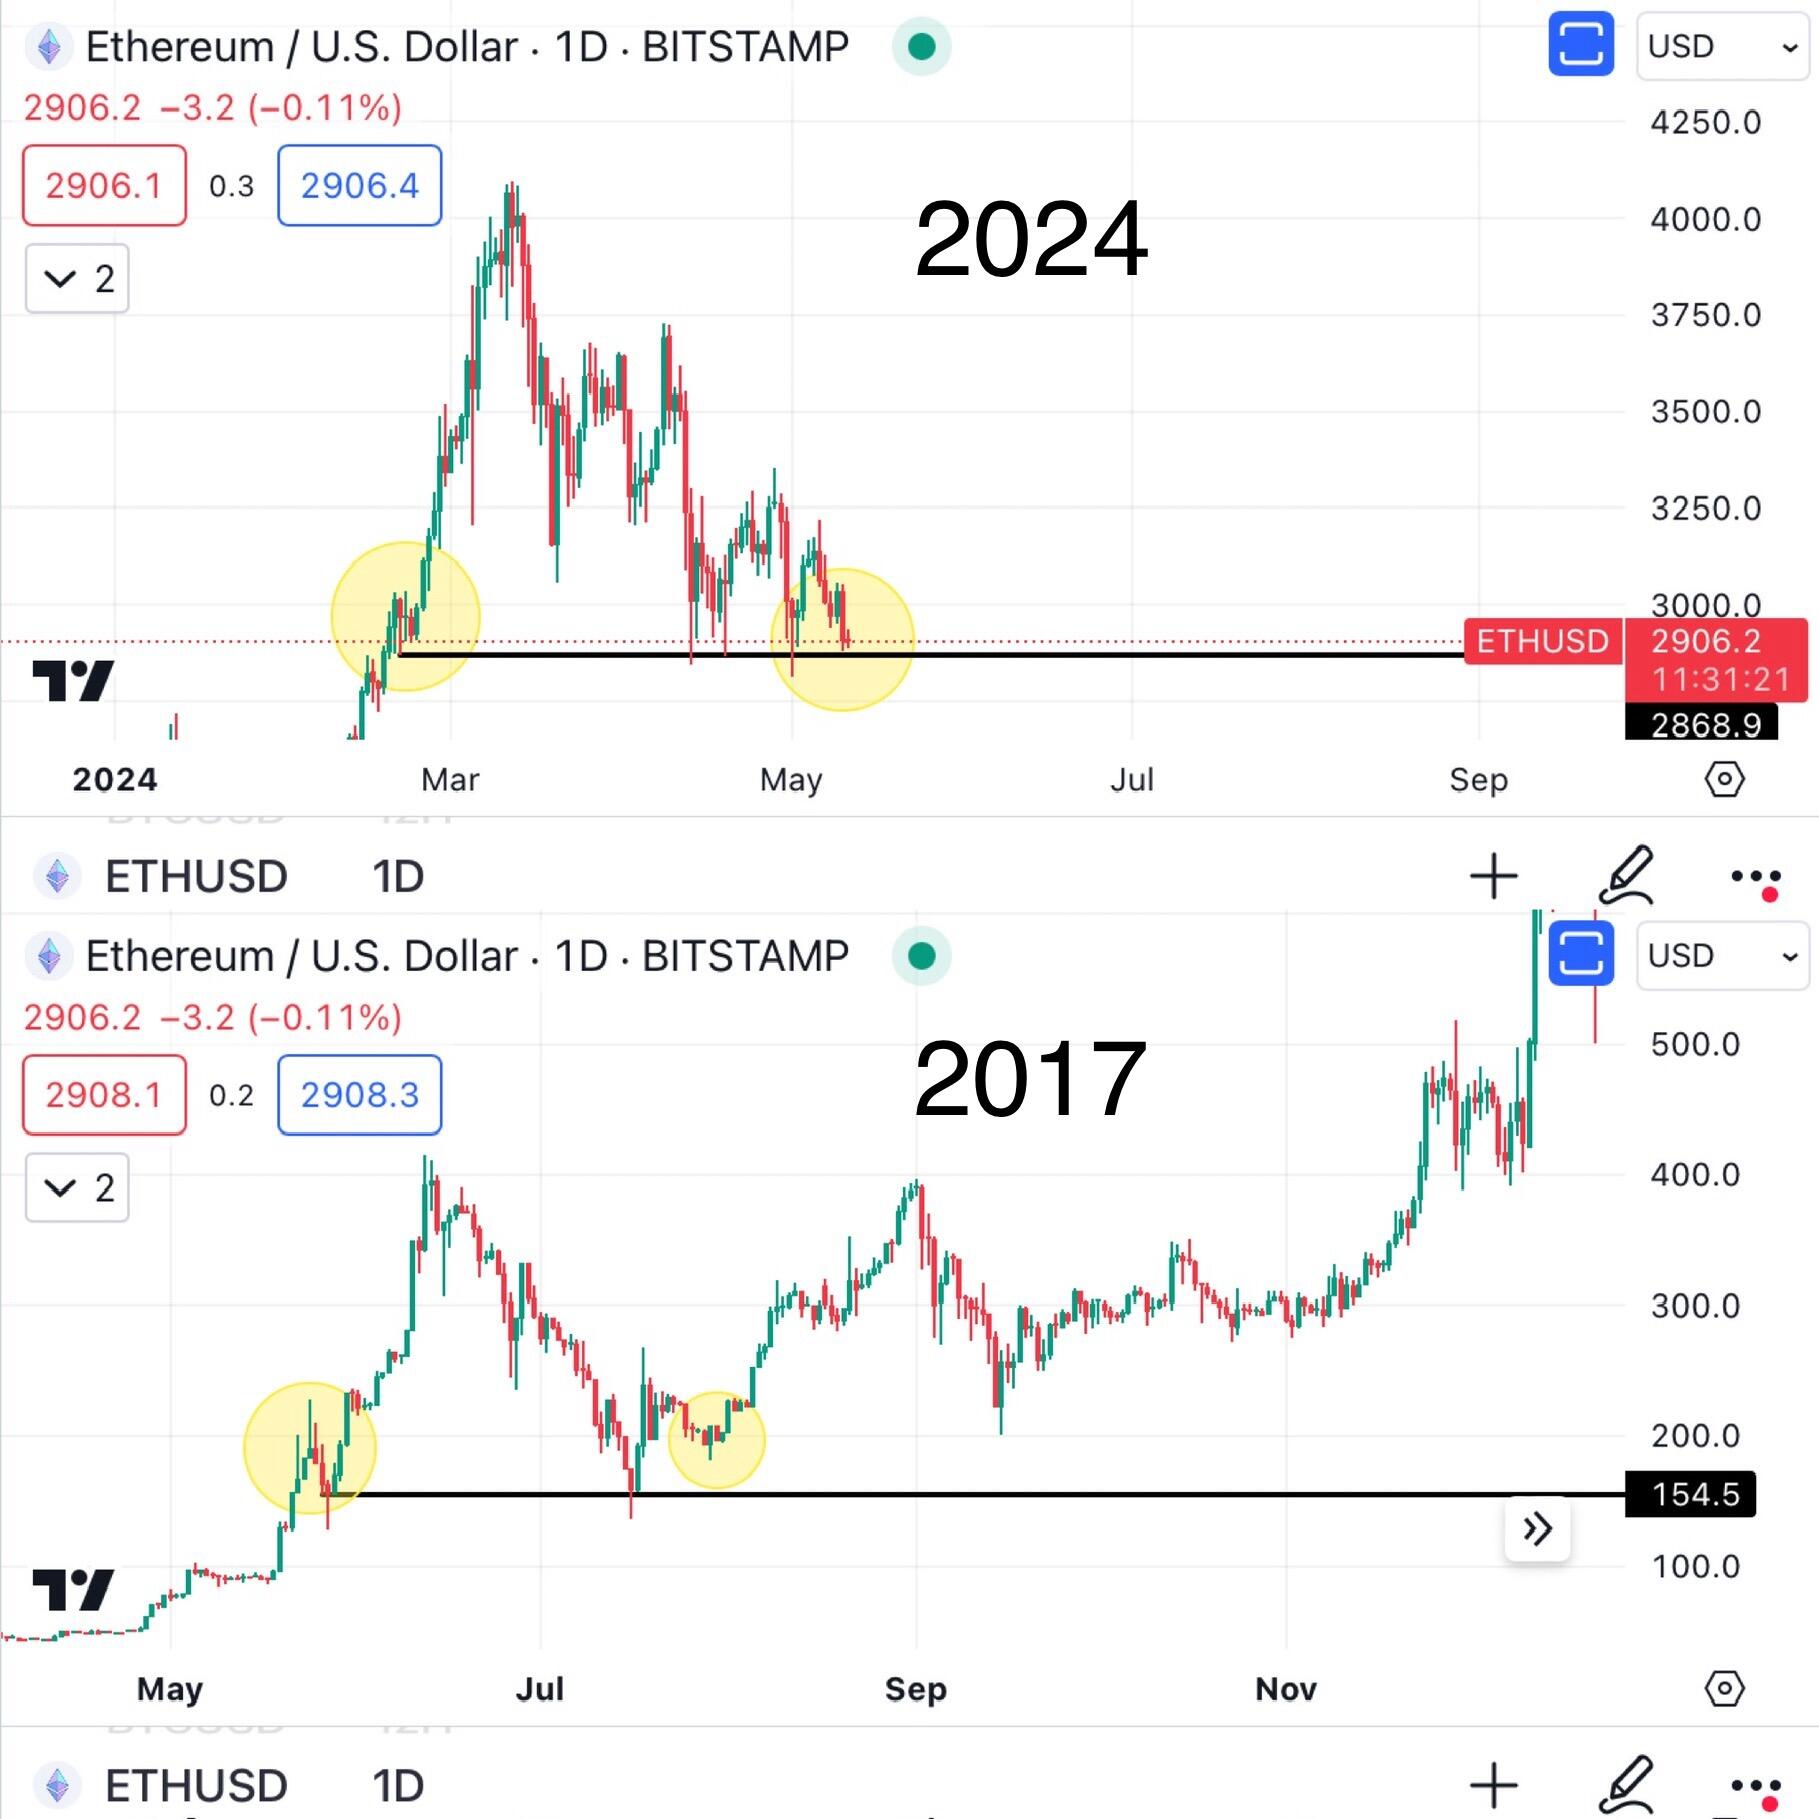
#Ethereum repeats fractals.
We can observe that $ETH is repeating fractals from 2016-2017… so where is #ETH now compared to back then?
Ethereum was at the bottom of a range then. Ethereum, today, has either found the bottom or is still looking for it. 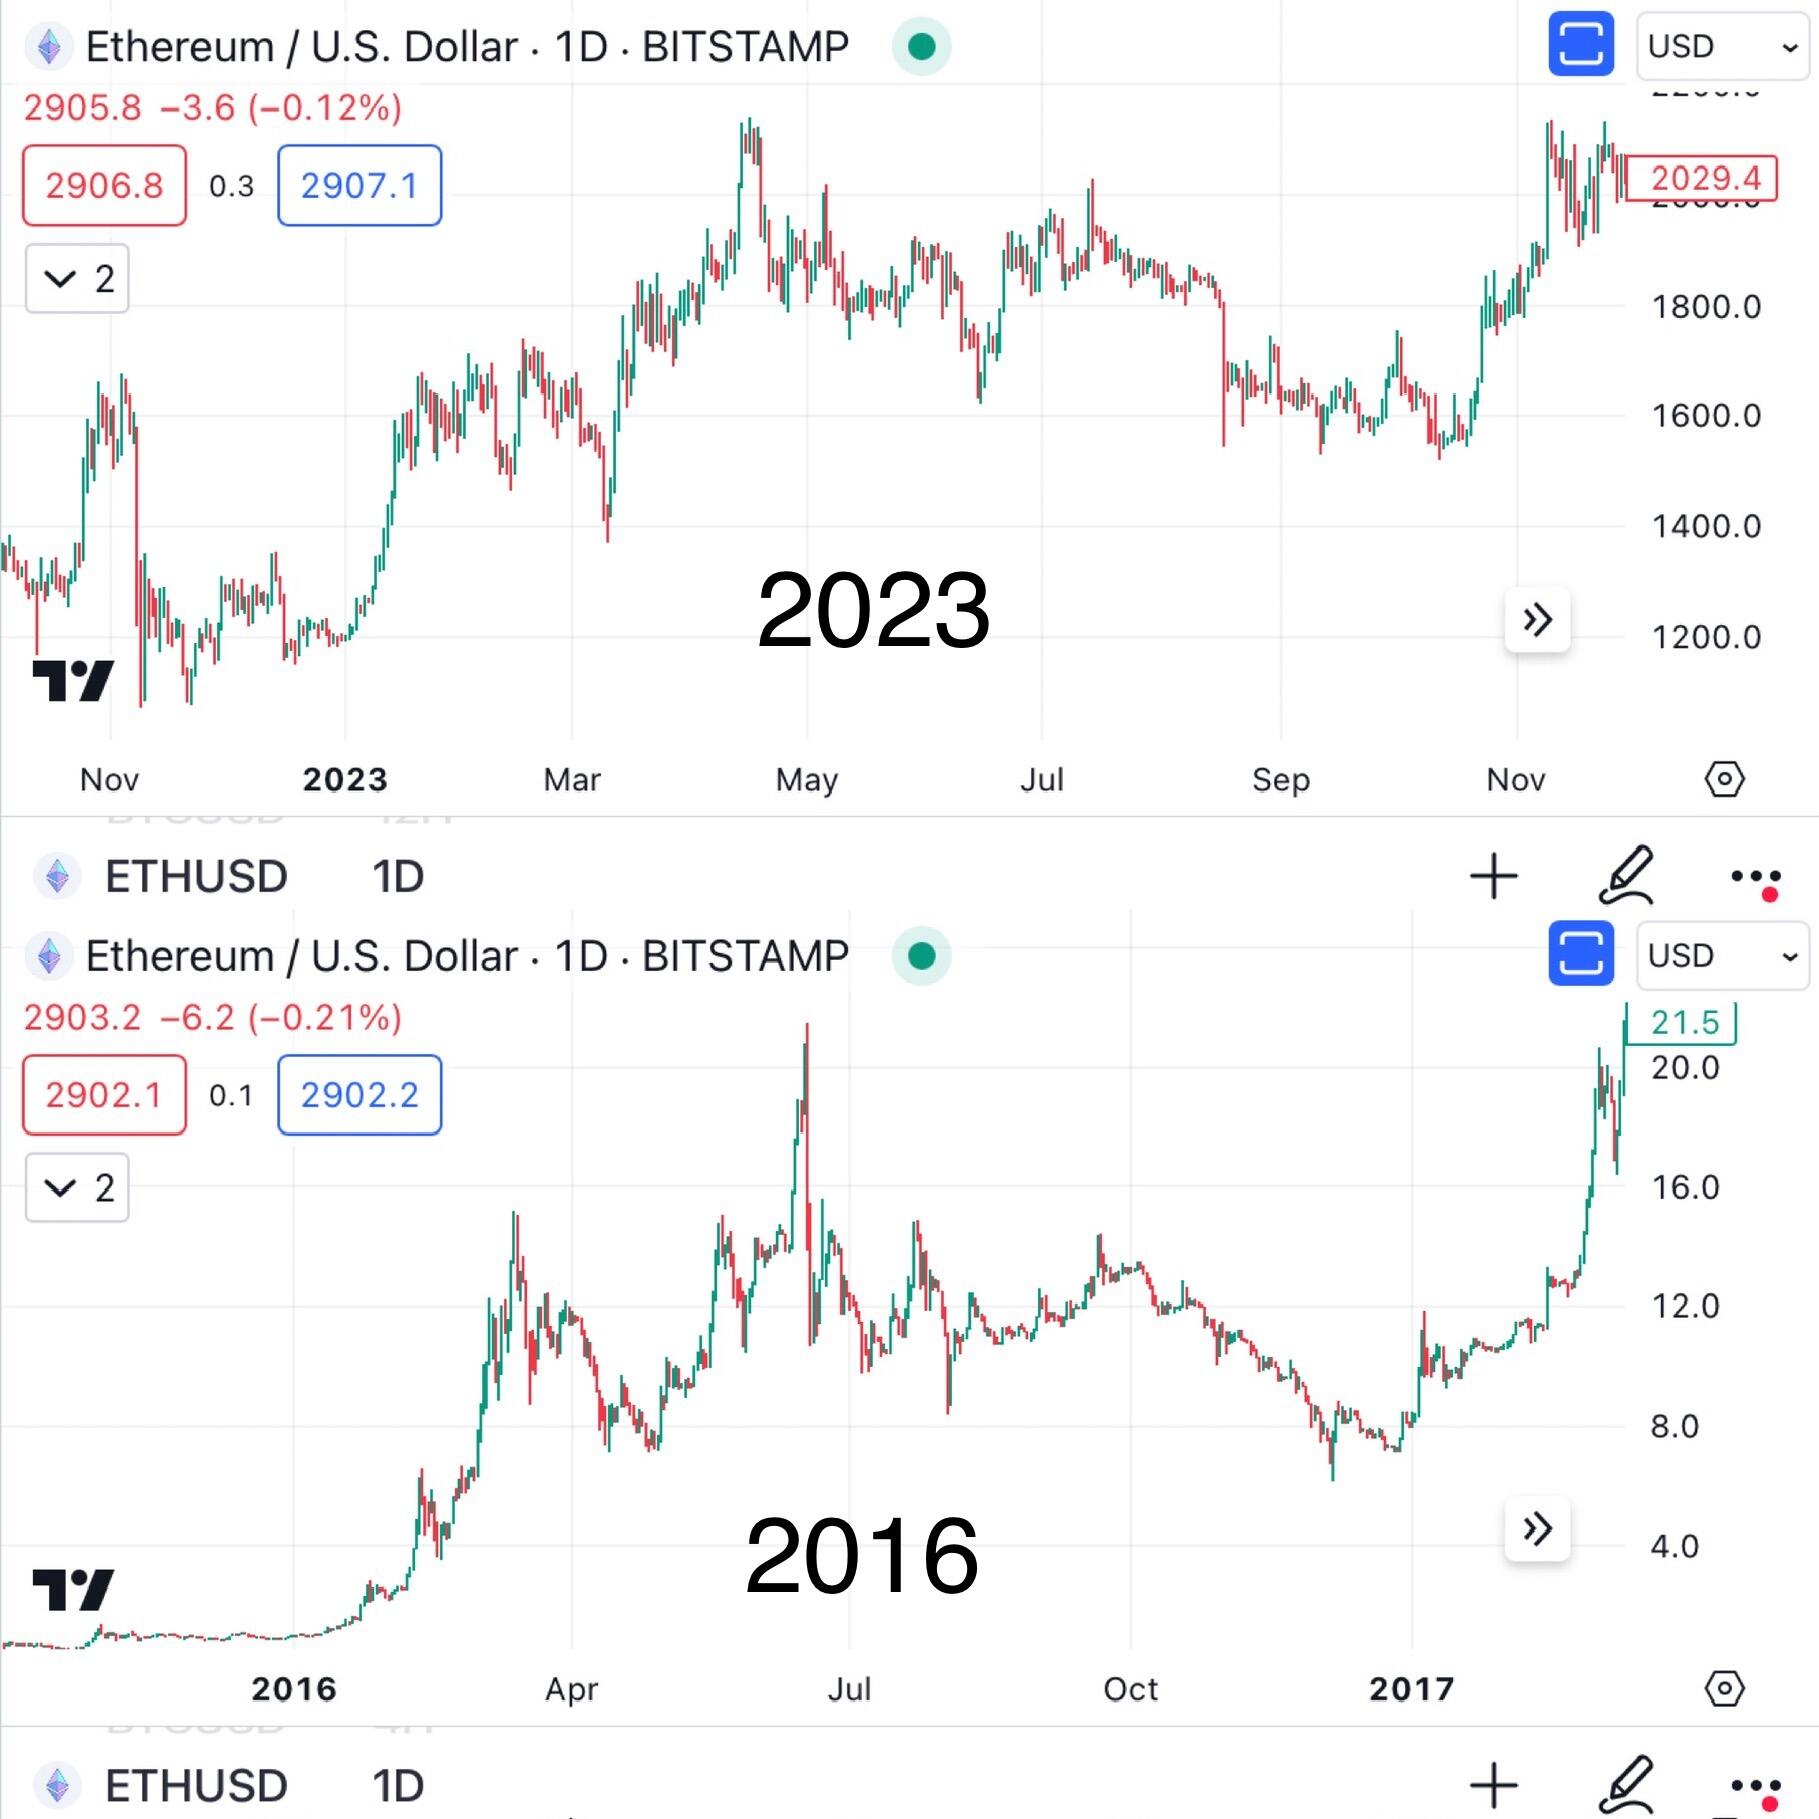
Hear me out. $XRP repeats fractals, but those fractals can be wildly exaggerated or muted.
Case in point, the 2018 and 2021 bull runs can be found in 2015 and 2016.
Sure, 2015 and 2016 were run ups, but they were not bull runs for #XRP. 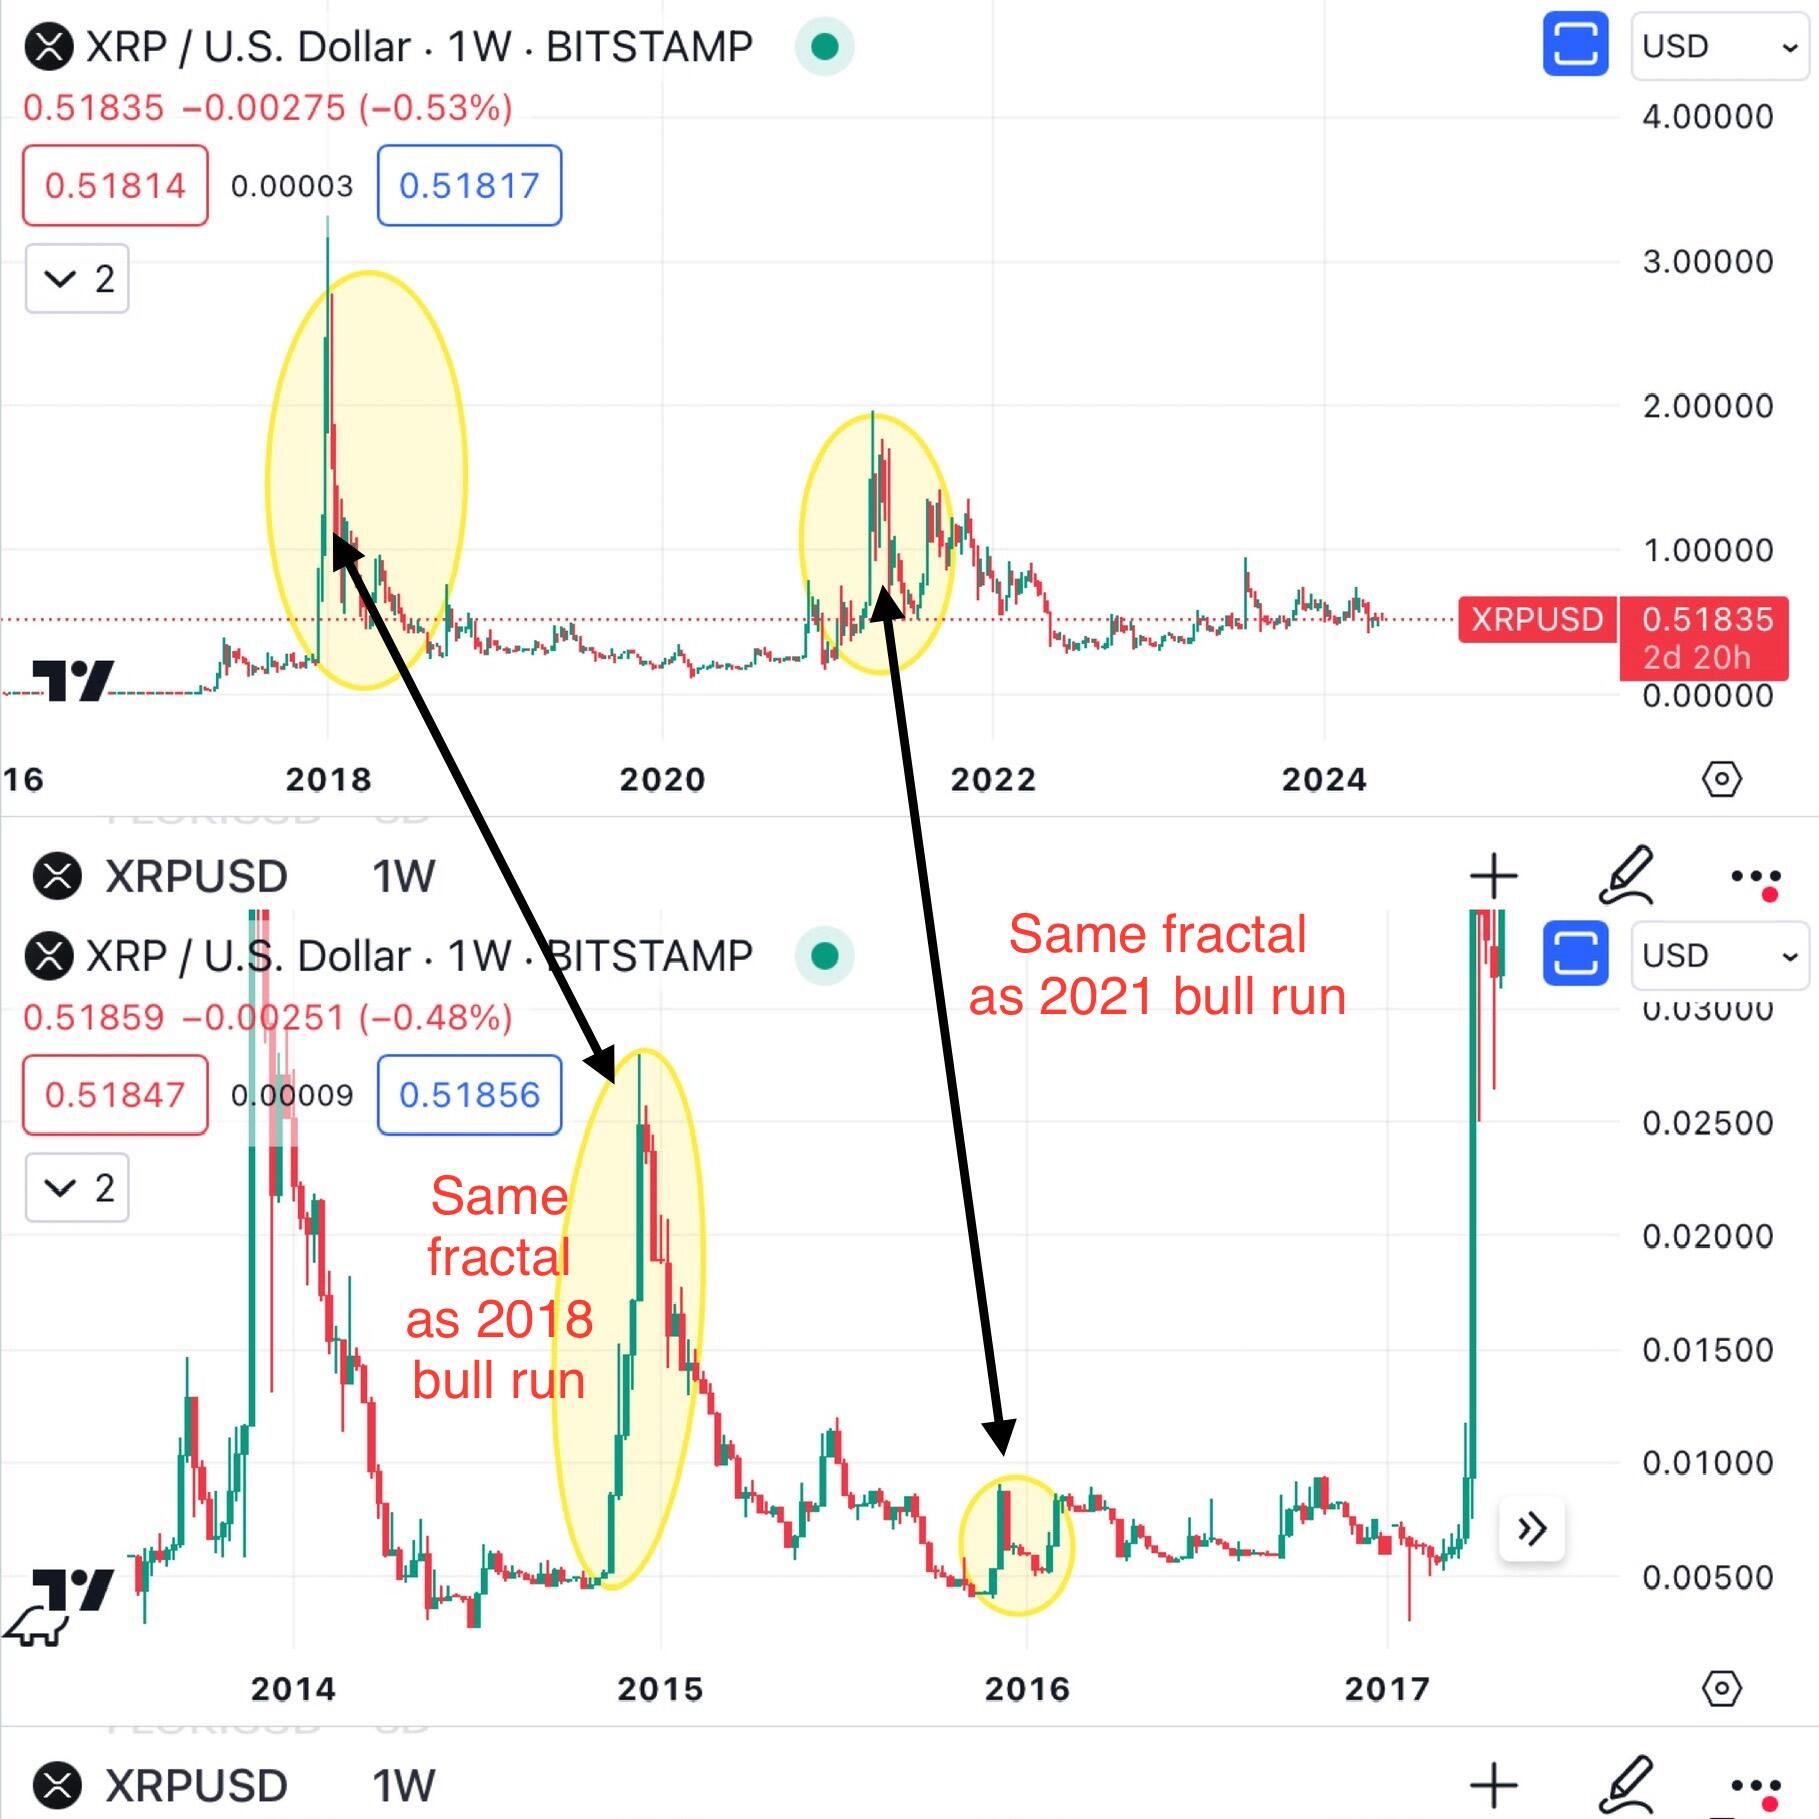
#Gold made a monthly topping tail. Since 2007, each time #XAU made a topping tail, had an RSI above 70, and Stoch above 80, gold prices fell 15-30%.
If gold were to fall 15-30%, it would either retest previous highs or retest the low in 2022. 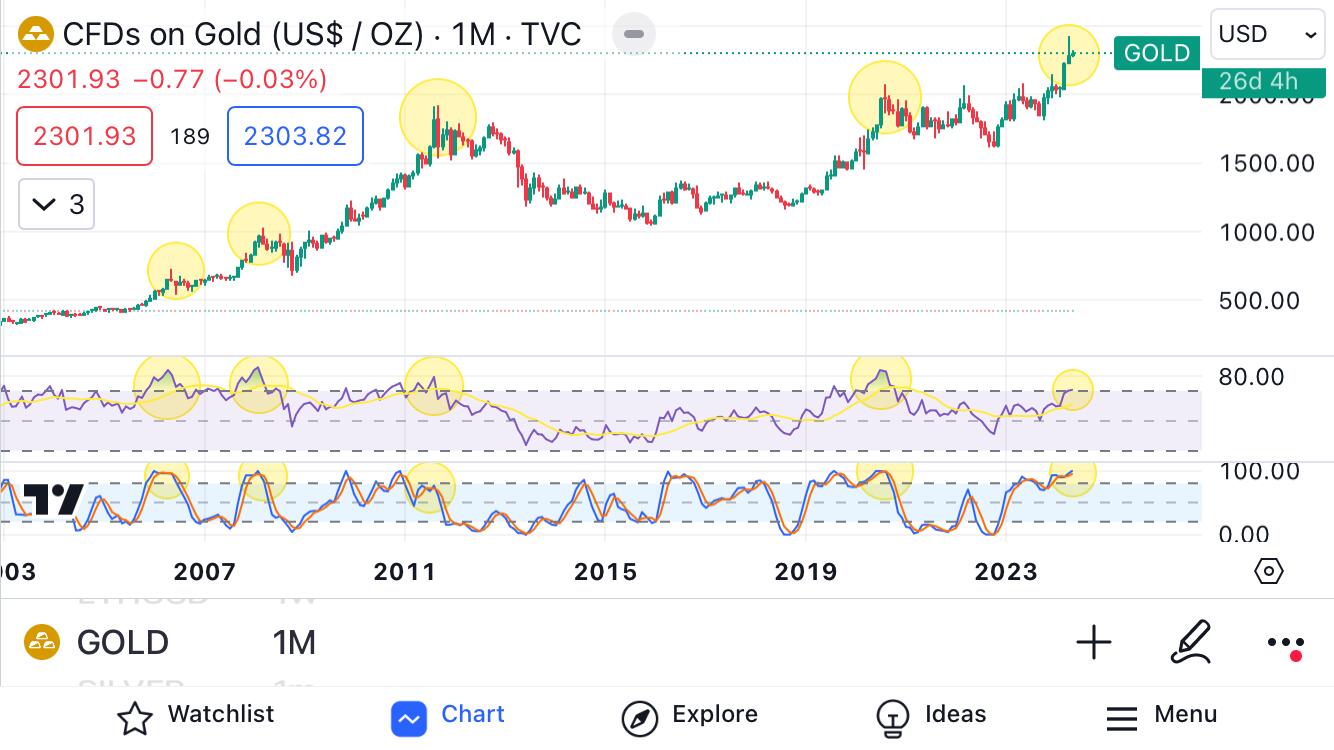
$STX acts like a leveraged $BTC.
#Stacks is completing its 4th wave, about to start its 5th, final, and most aggressive wave.
Targets between the 0.702-1.618 Fibonacci levels correspond with a price range between $4.19-$7.16. Of course, in #crypto, #Blockstacks can always potentially aim for higher fib levels. 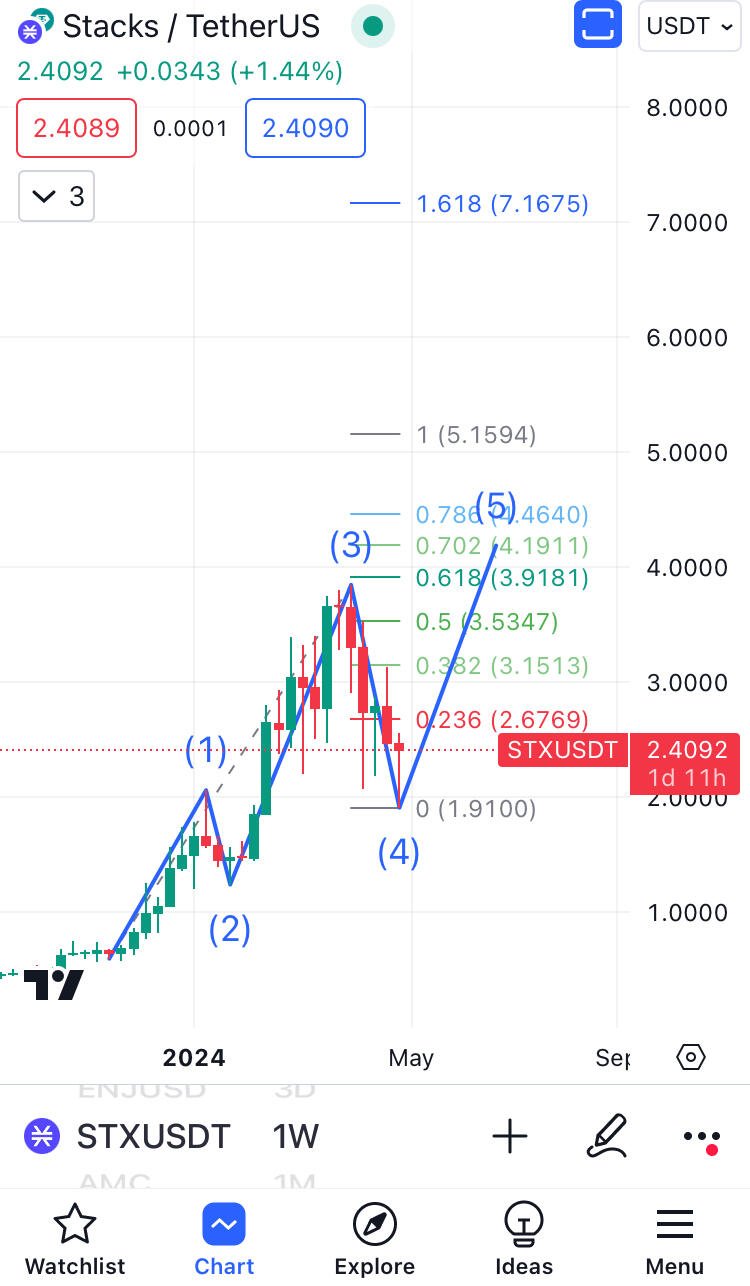
$GME up near 30% on the day. Is $AMC next?
We can see that #Gamestop and #AMC both had bottoming of price, RSI, and Stoch on April 15th.
The difference is that #GME was able to bounce above its 200SMA, and AMC could not. Still… keep an eye on it! 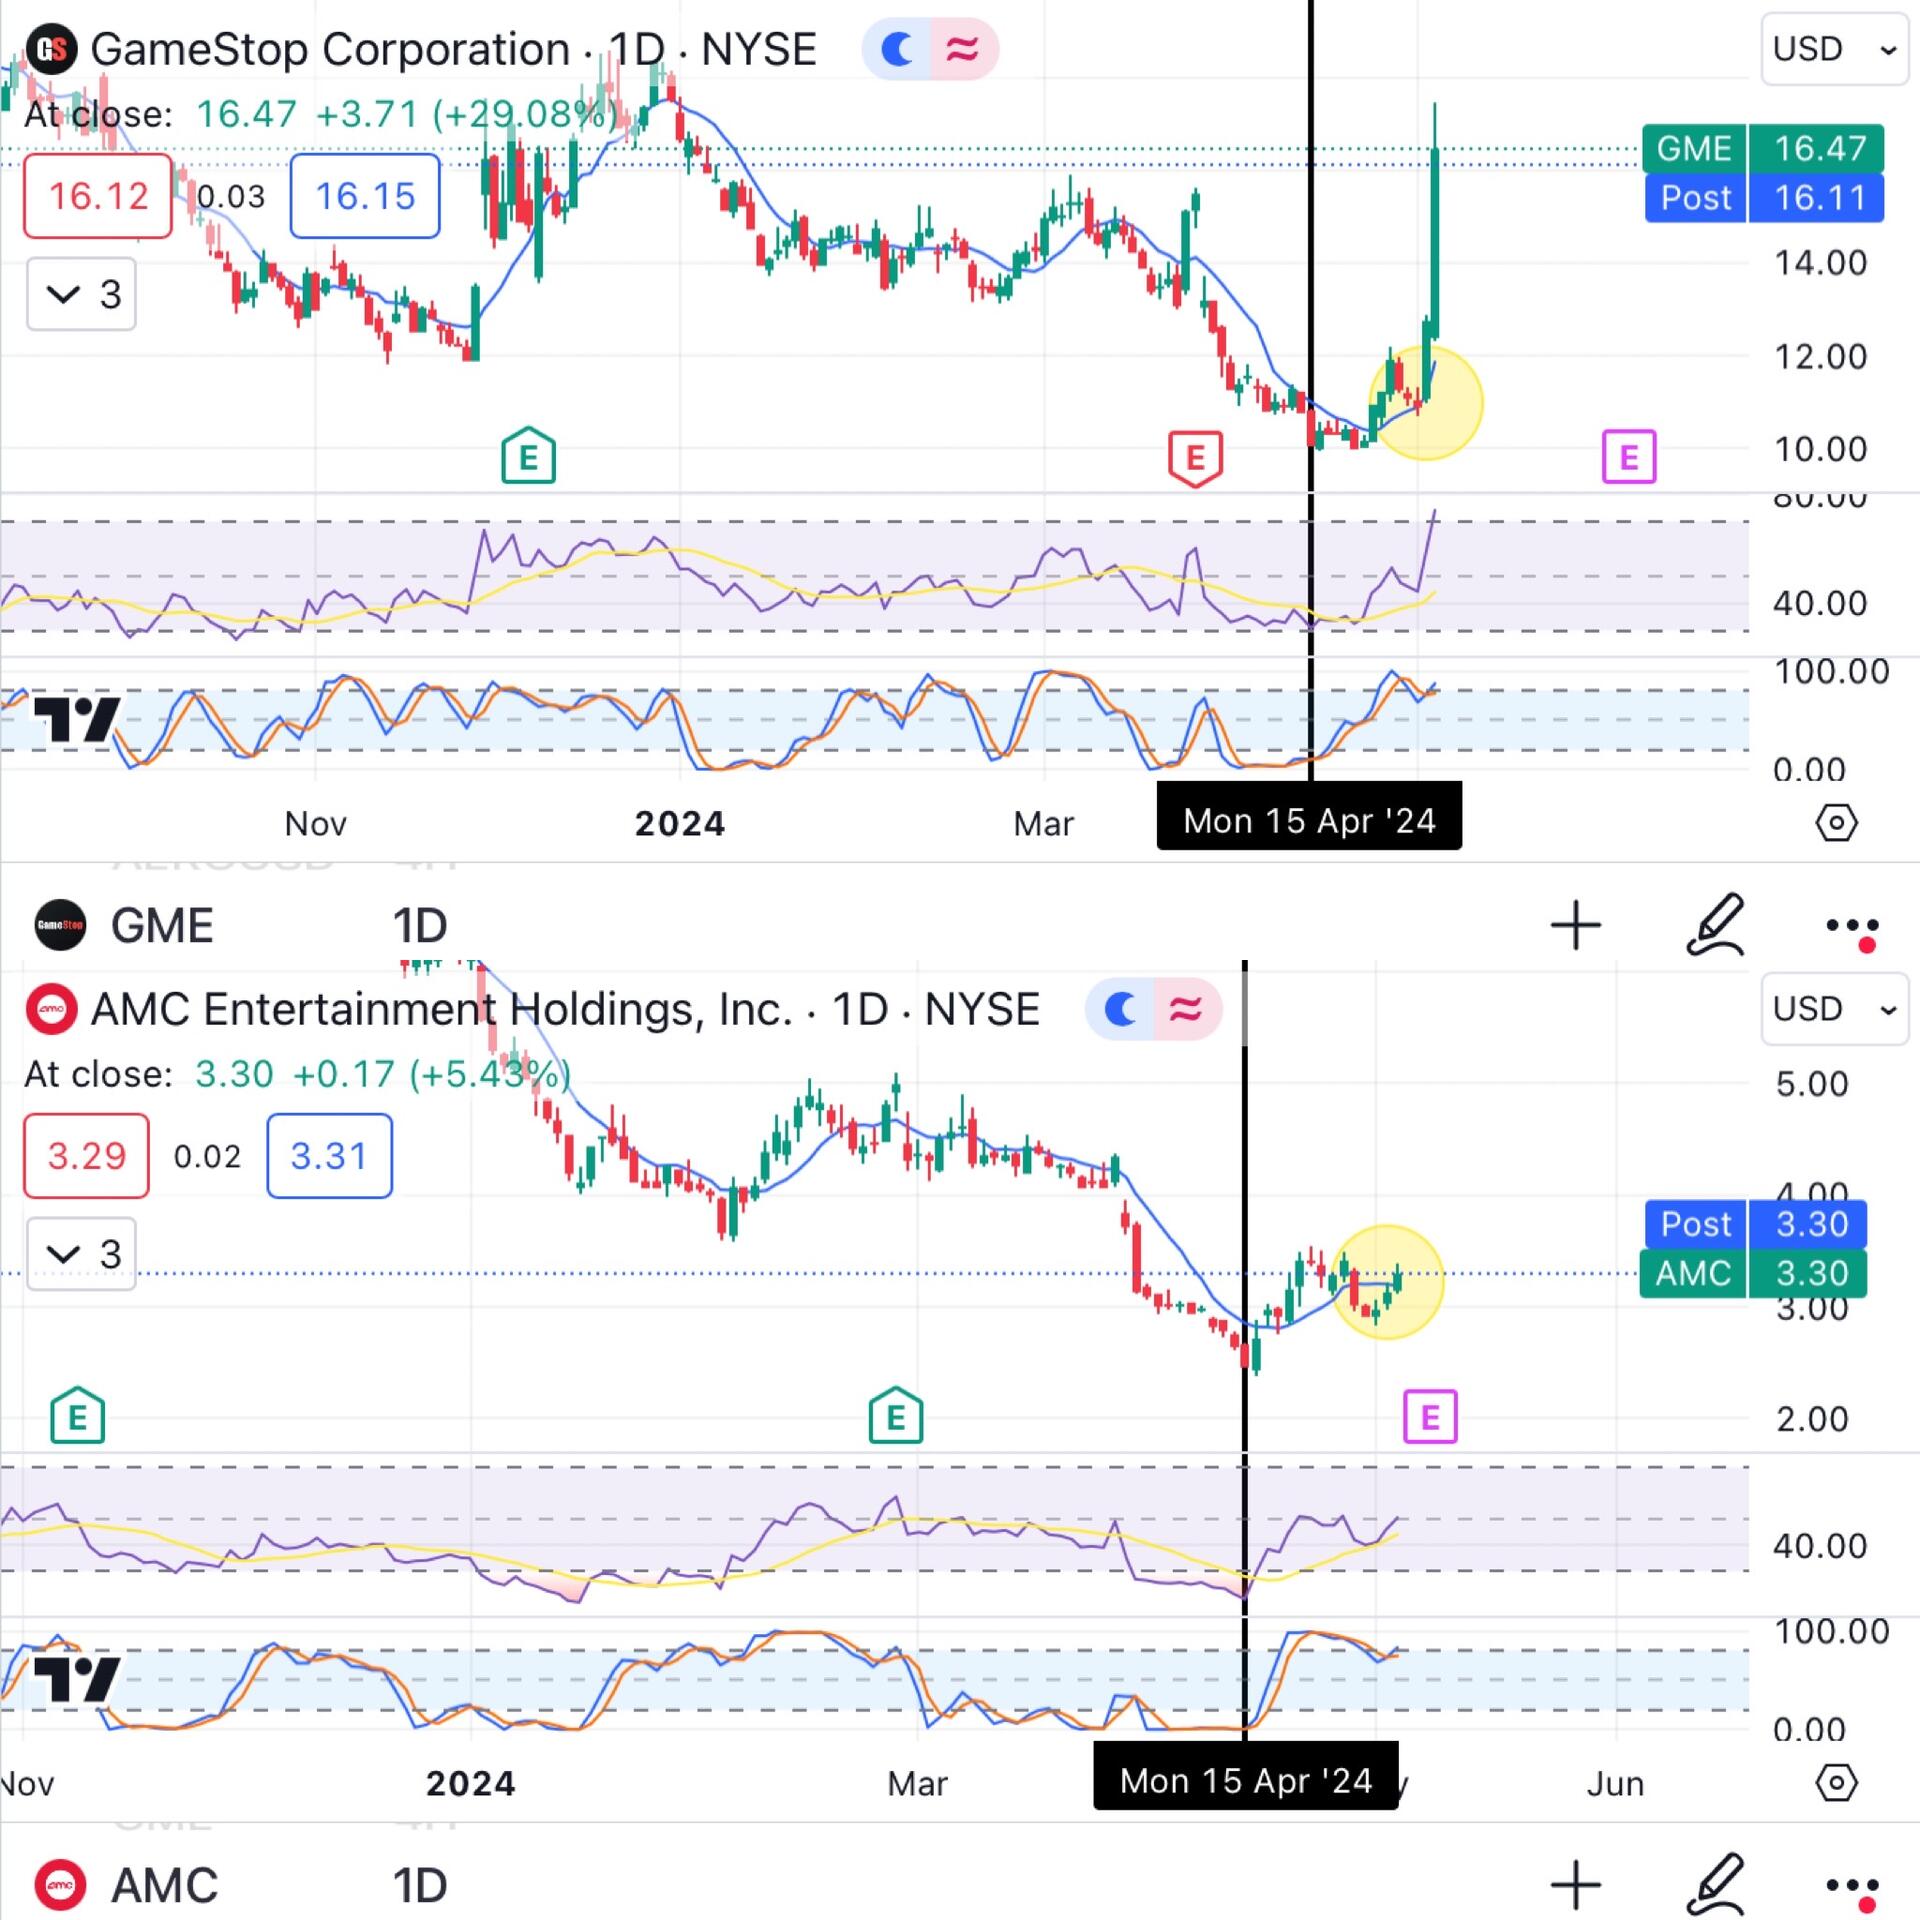
#Ethereum hit its bull market support band, and its Stoch is curving up.
However, $ETH price action and RSI have yet to reach a support level that I’m interested in. There may be more downside, but that would be a healthy move for #ETH 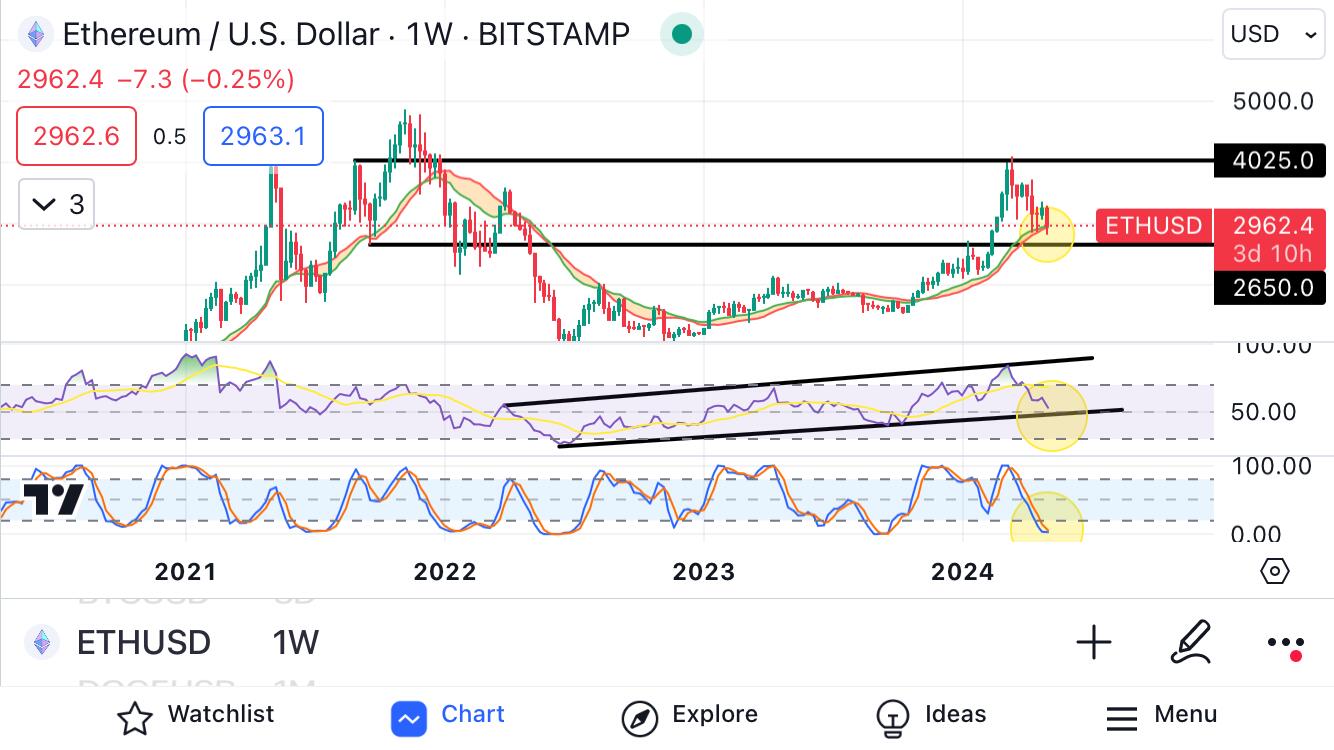
Let’s not pretend that this region is a phenomenal price range to stack #Stacks.
$STX is at a strong level of support, not just at a demand zone, but within an RSI channel, AND the weekly Stoch is curving upwards. Good things are coming for #Blockstacks 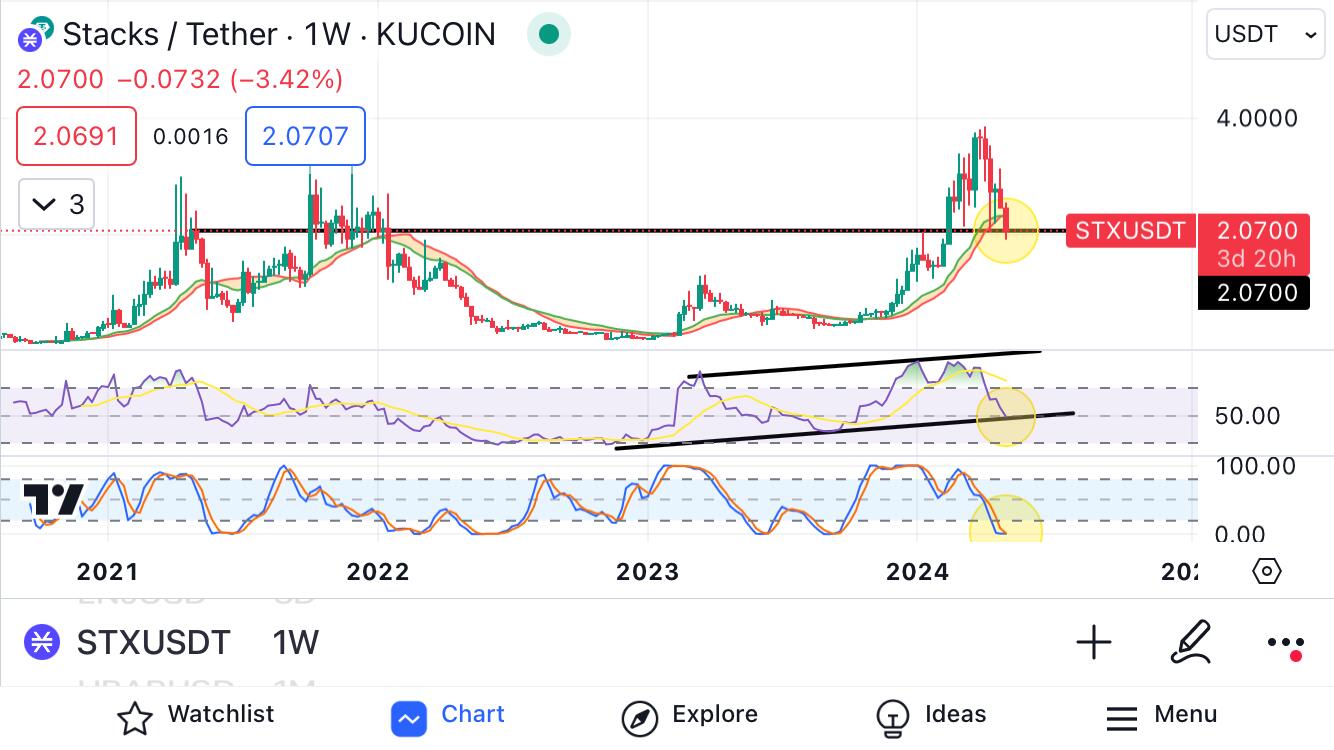
$XRP has broken structure, and diverged from its fractal made in March 2017.
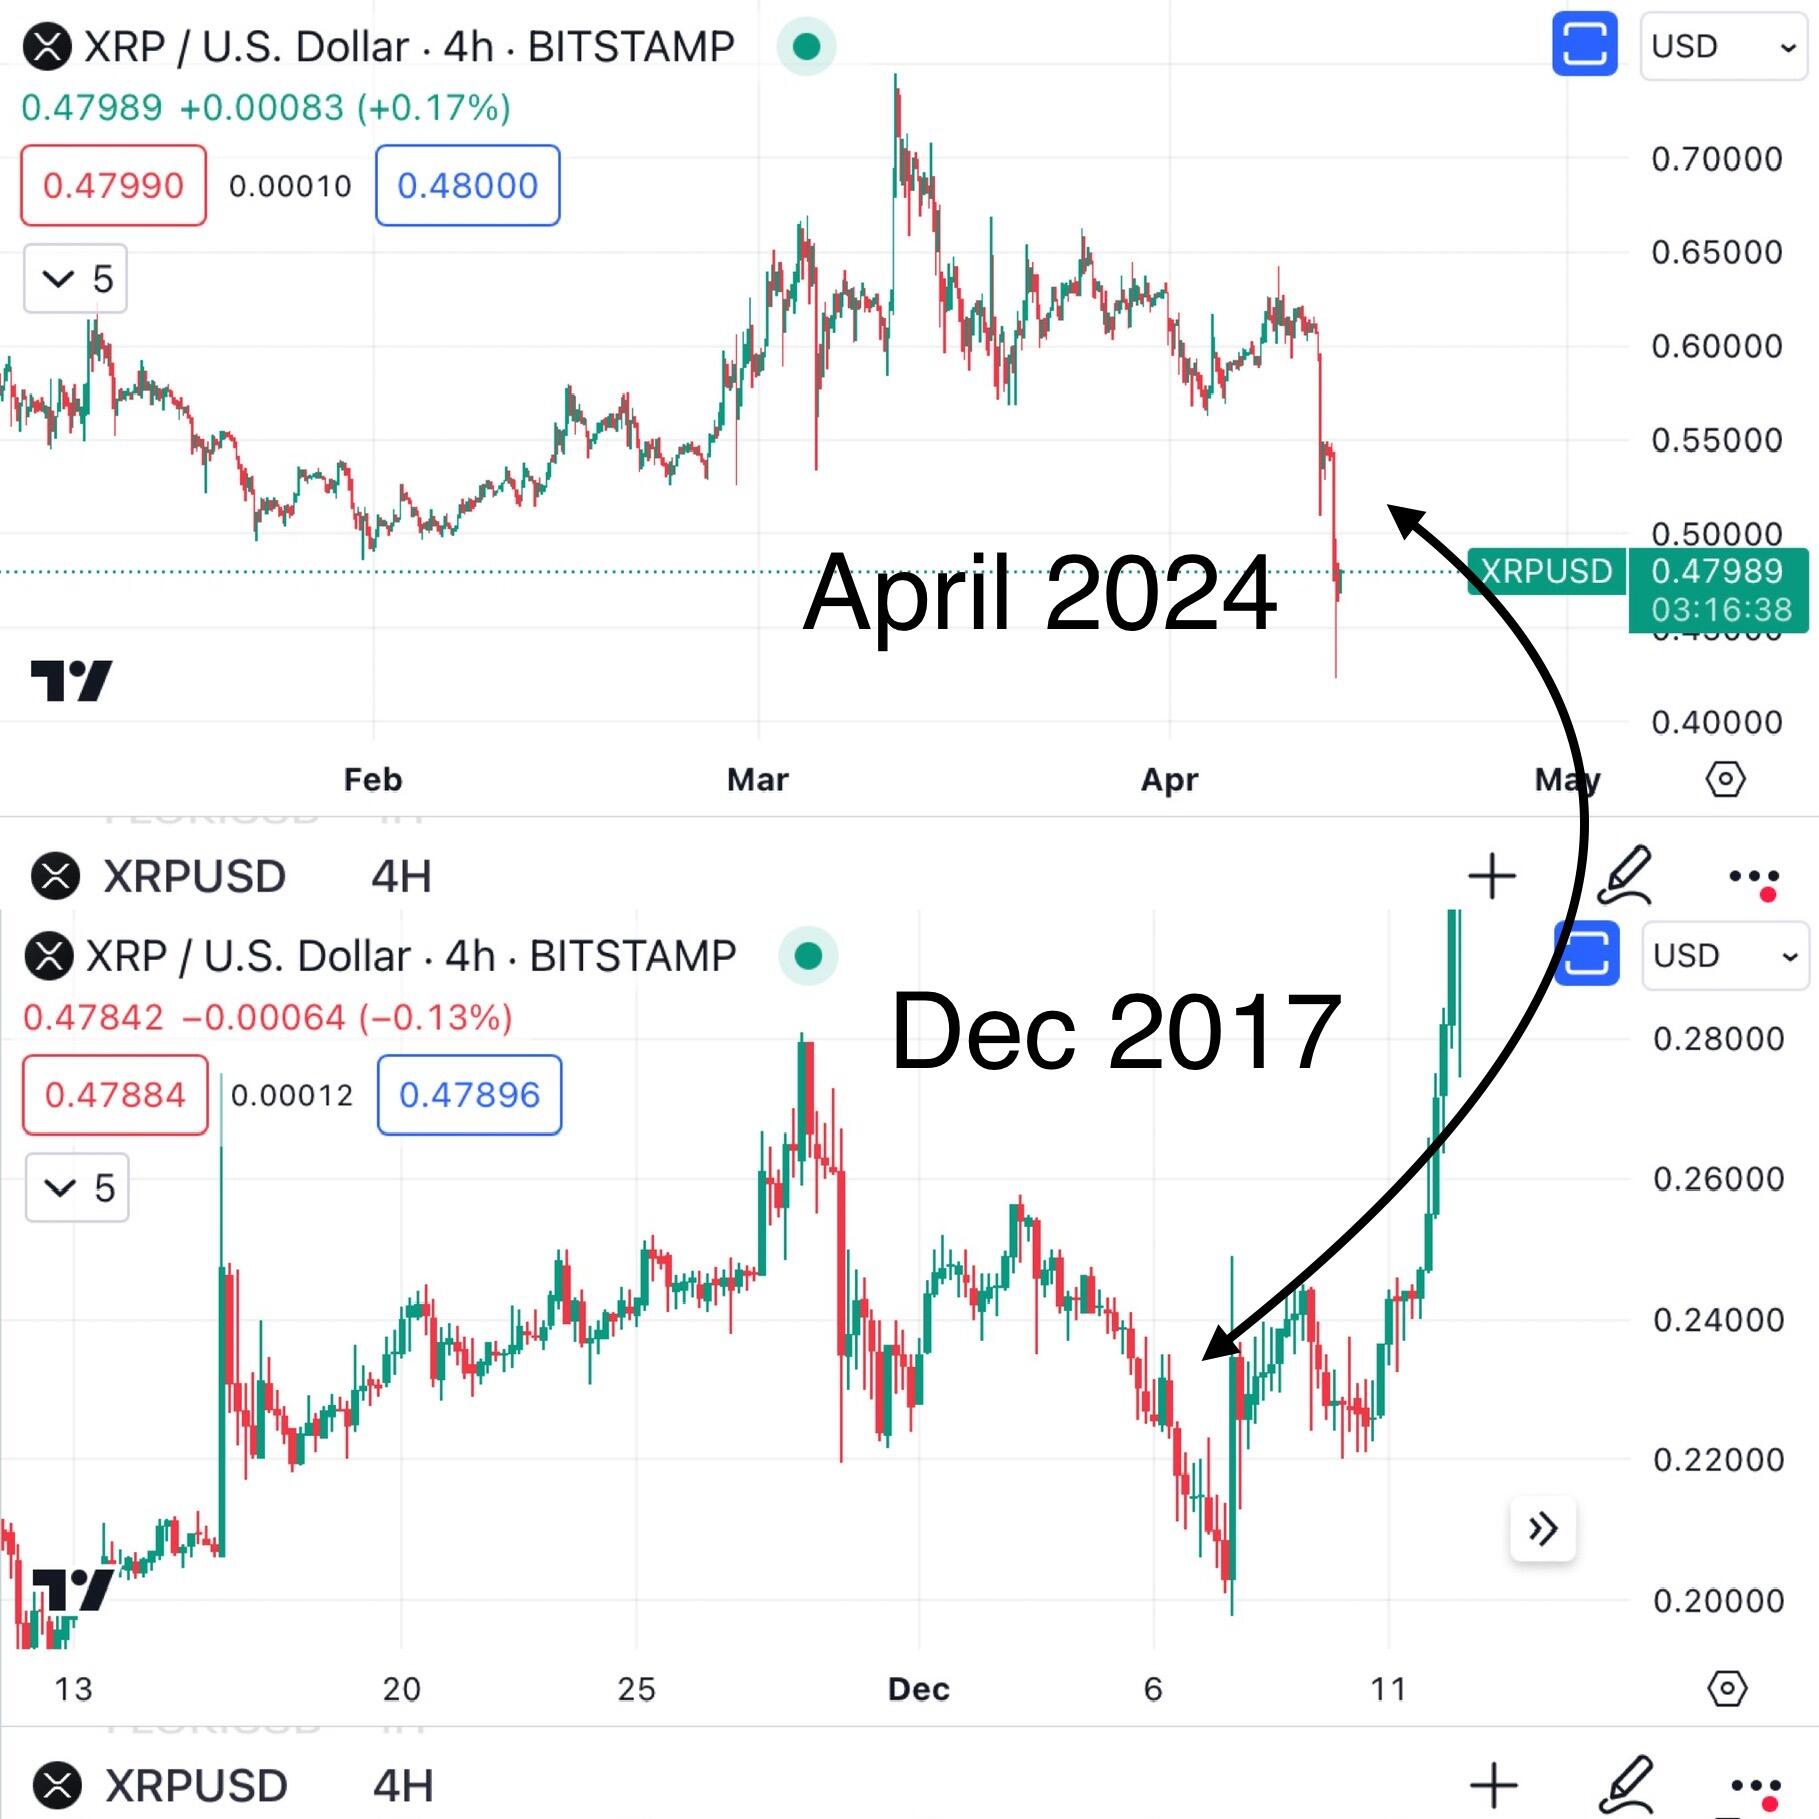
I suspect that #XRP could be in a different phase than previously thought, and following a different fractal - that of December 2017. 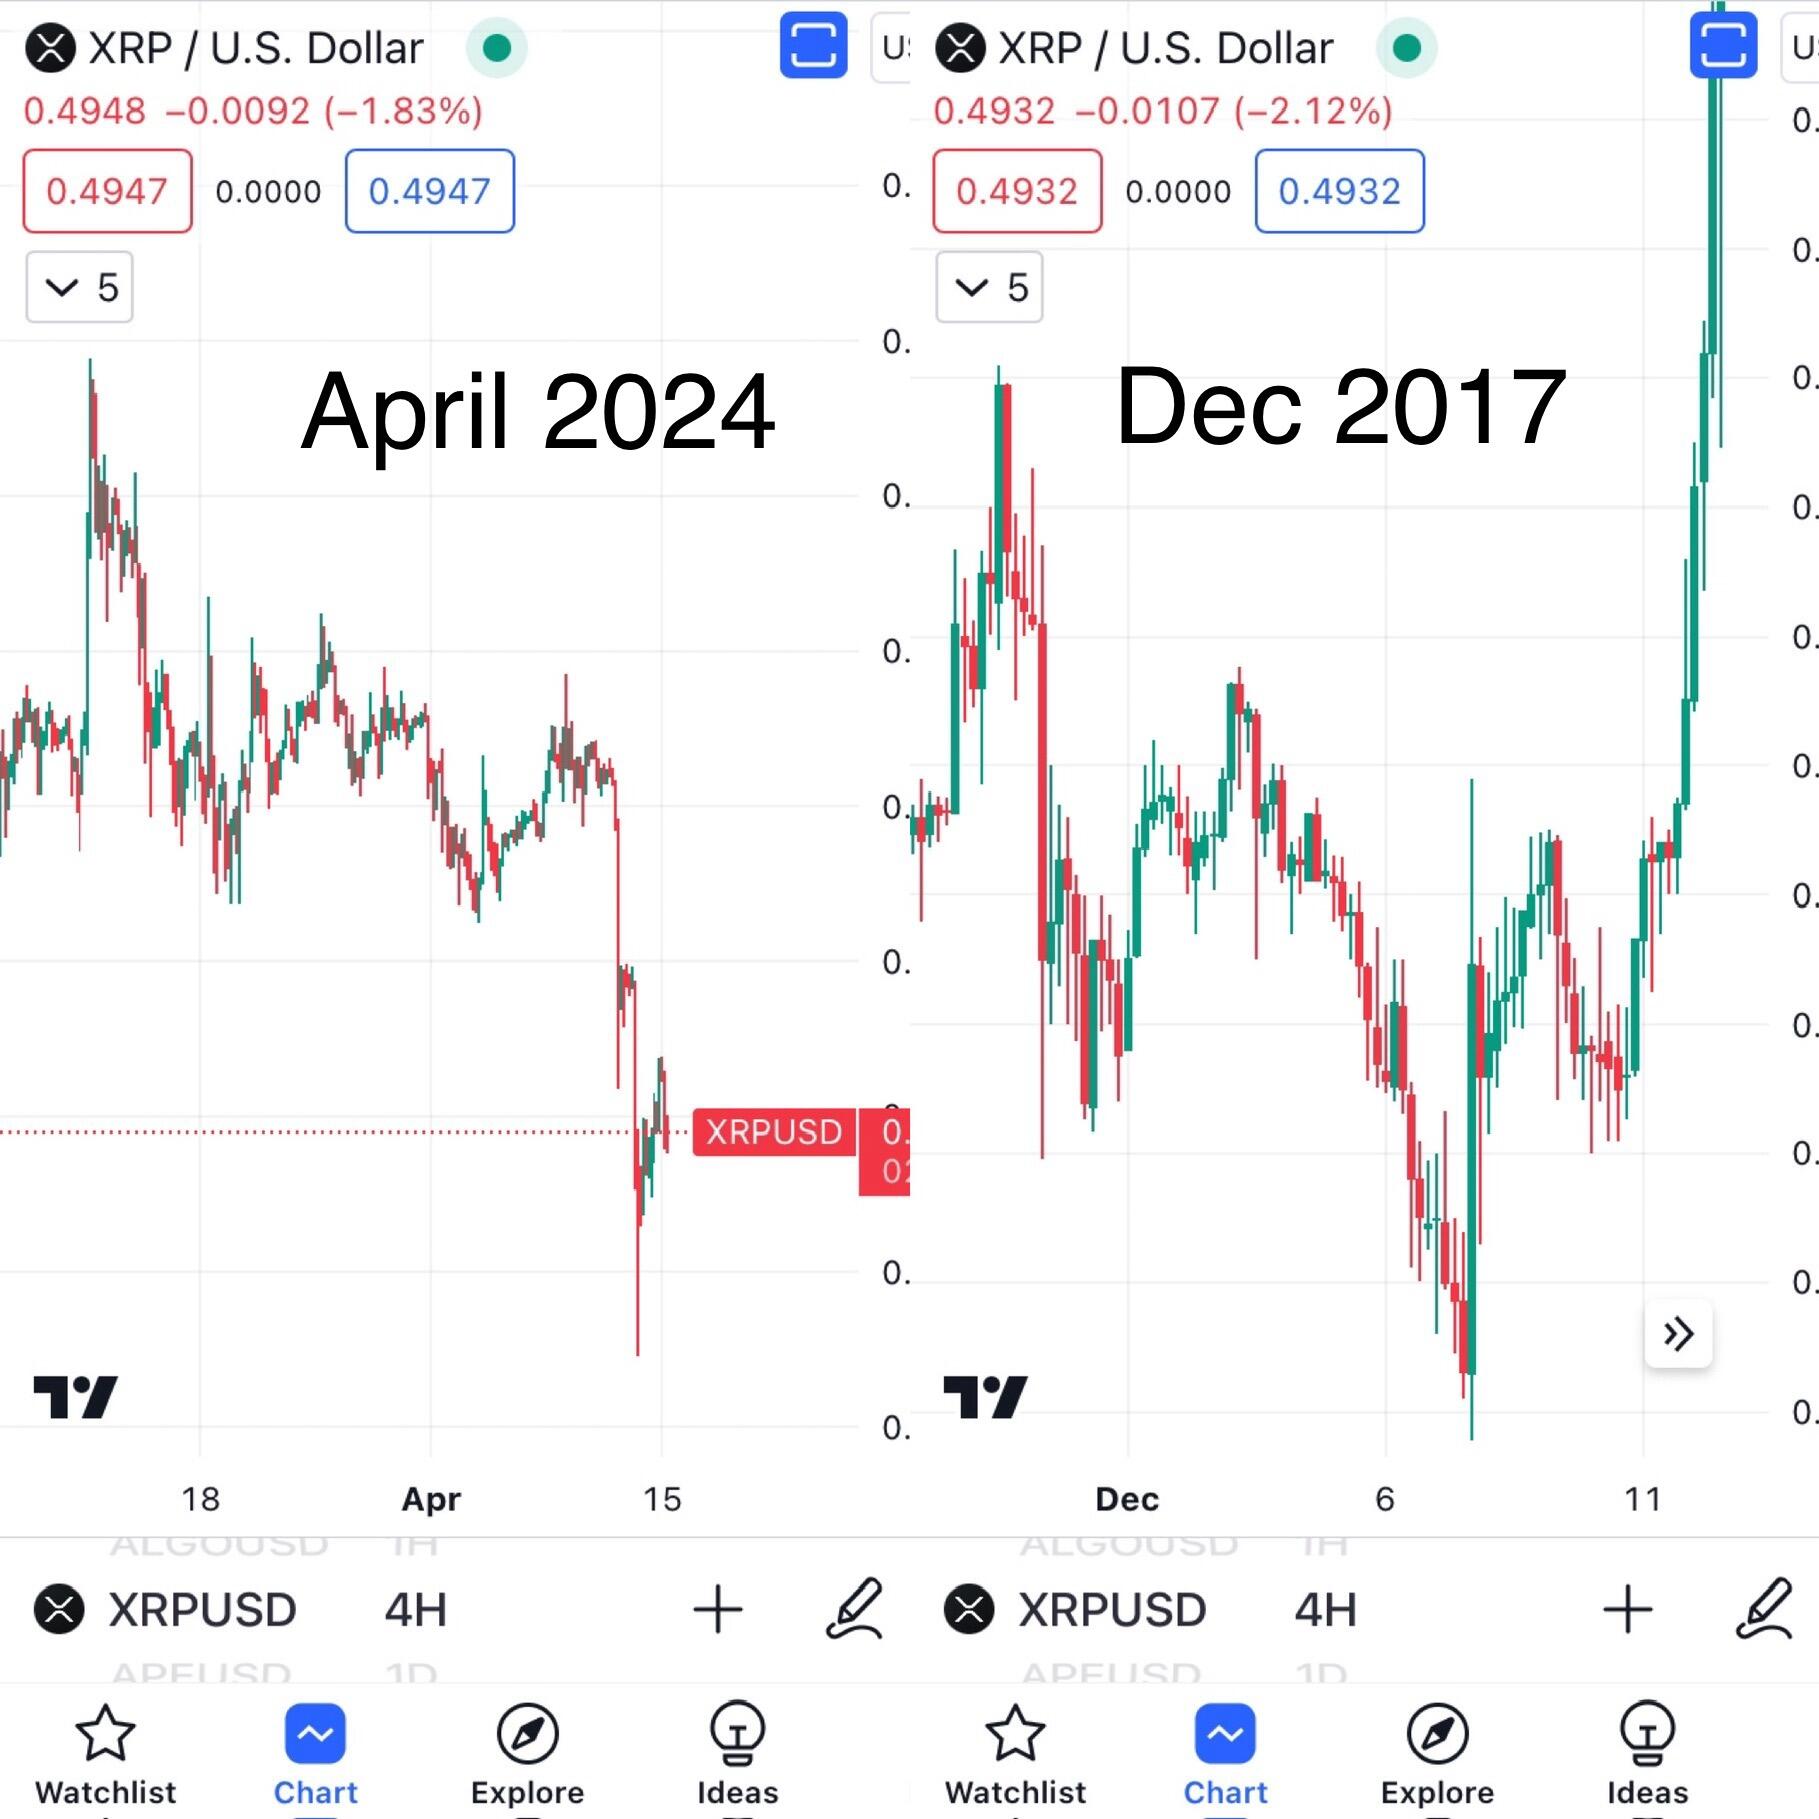
If #Bitcoin is following 2017, and going to test the Bull Market Support Band, then this upcoming week isn’t going to be pretty.
However, it would be healthy for $BTC to test the BMSB, fill liquidity below the current price, so #BTC can fuel up to go higher. 
$XRP fractal looking more like December 2017, rather than March 2017.
If true, and considering #XRP typically moves last, this bull run may end before end of the year… possibly even sooner. 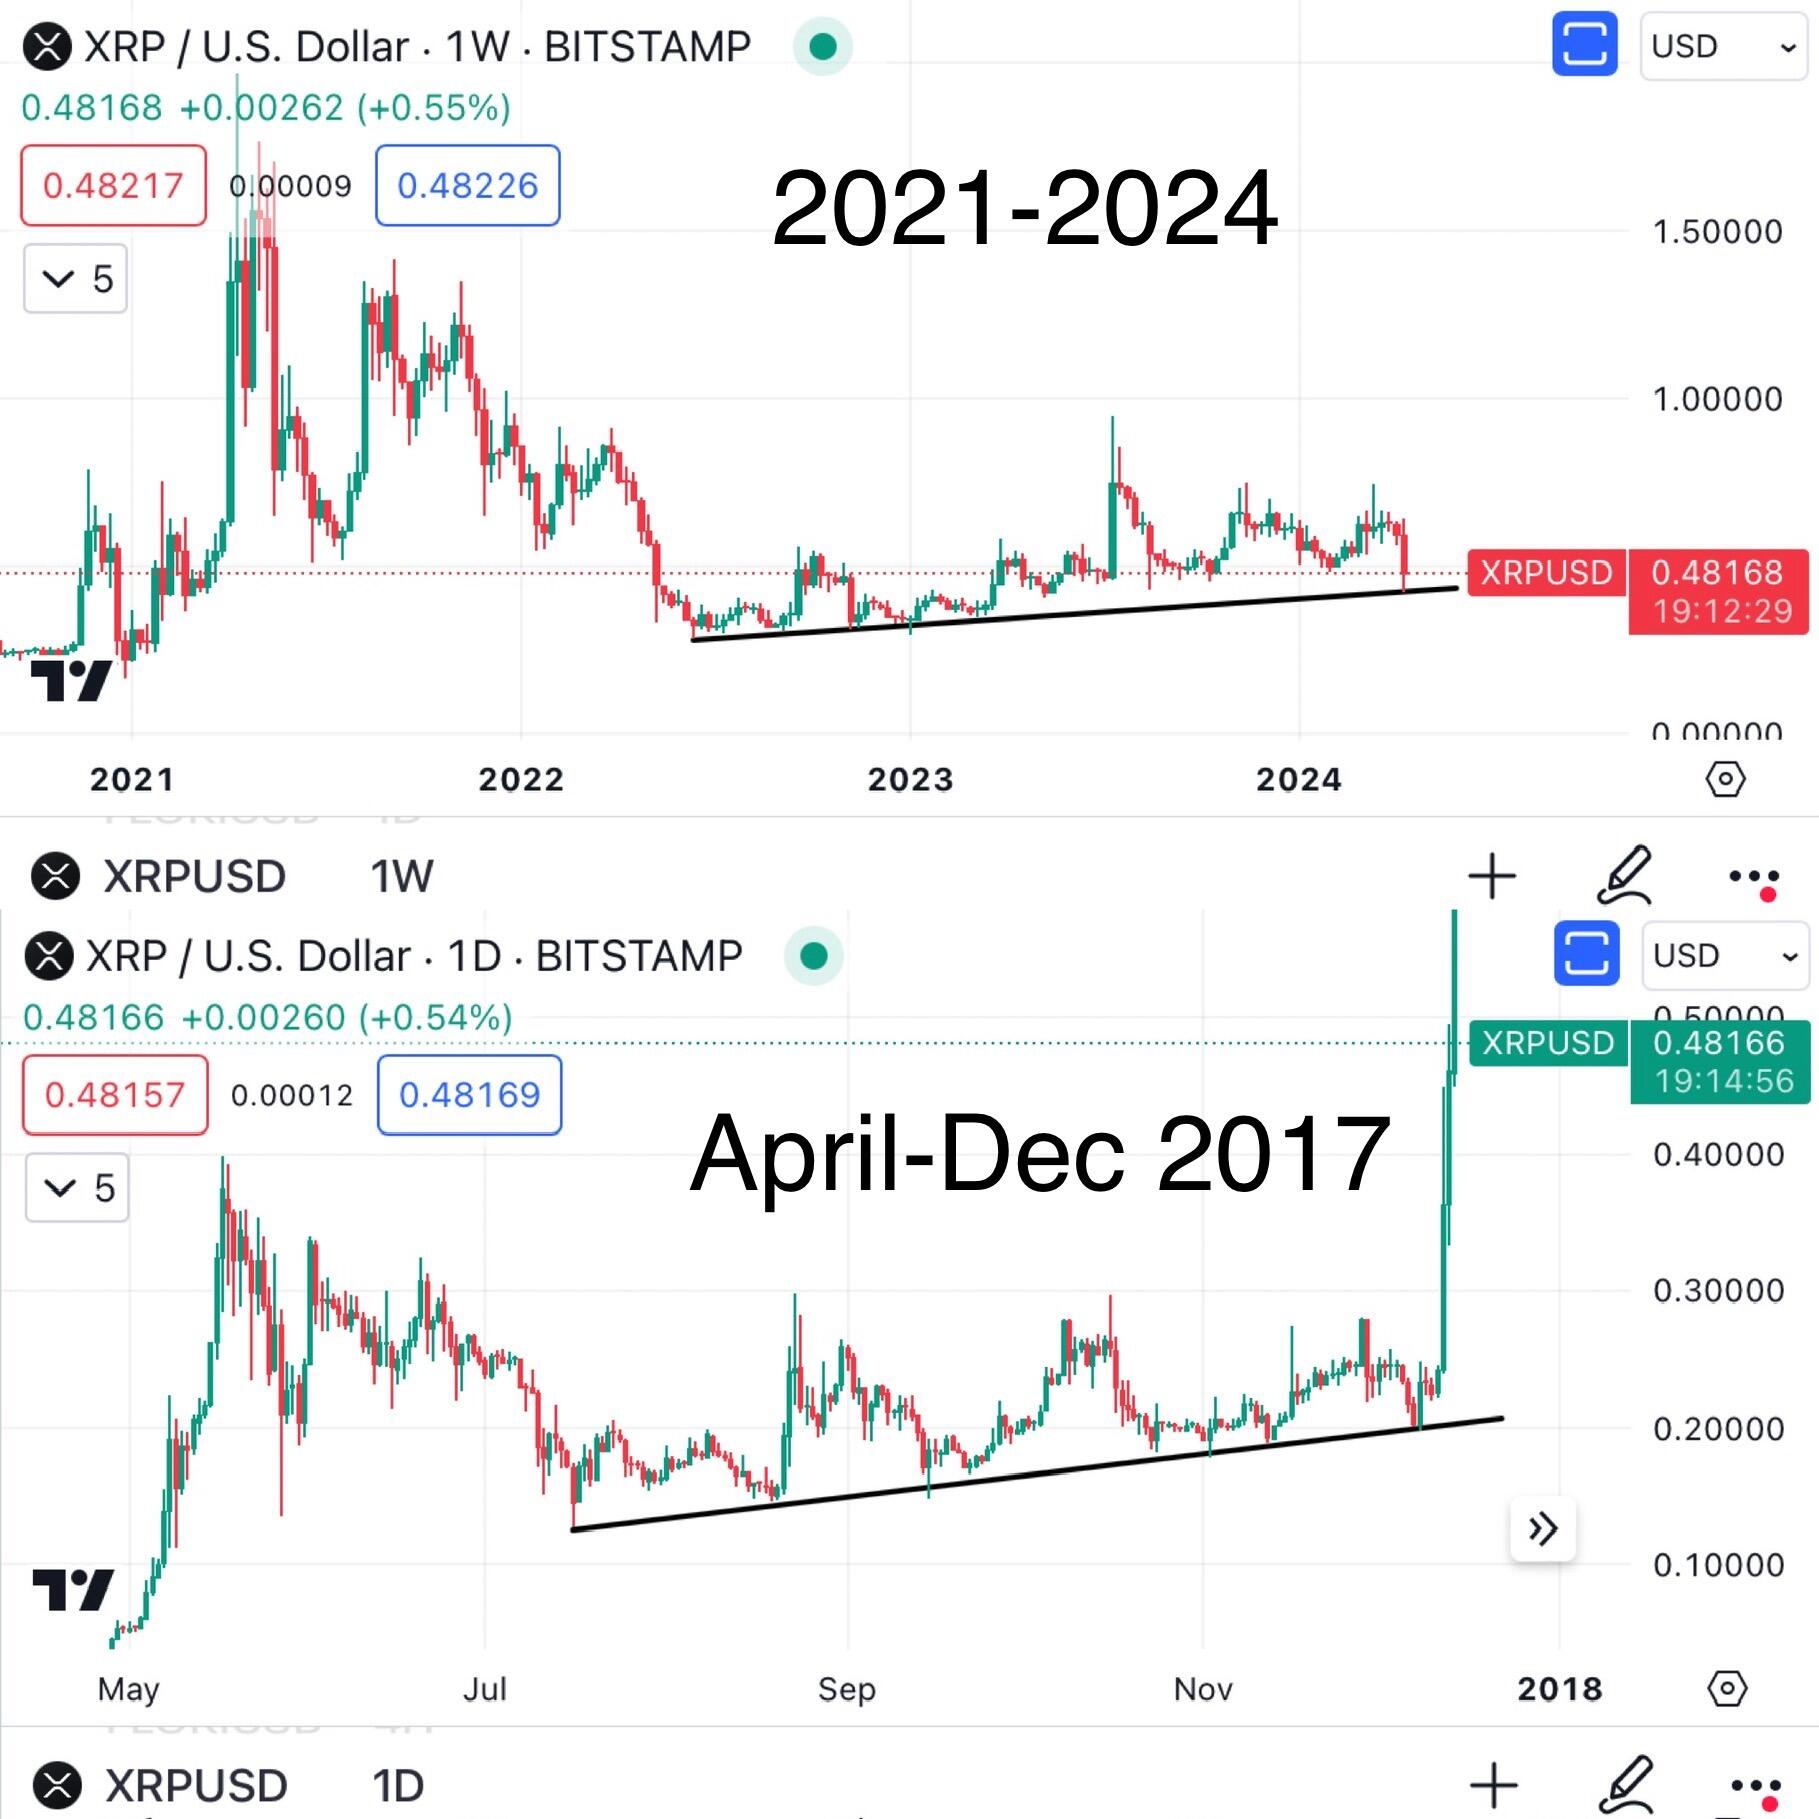
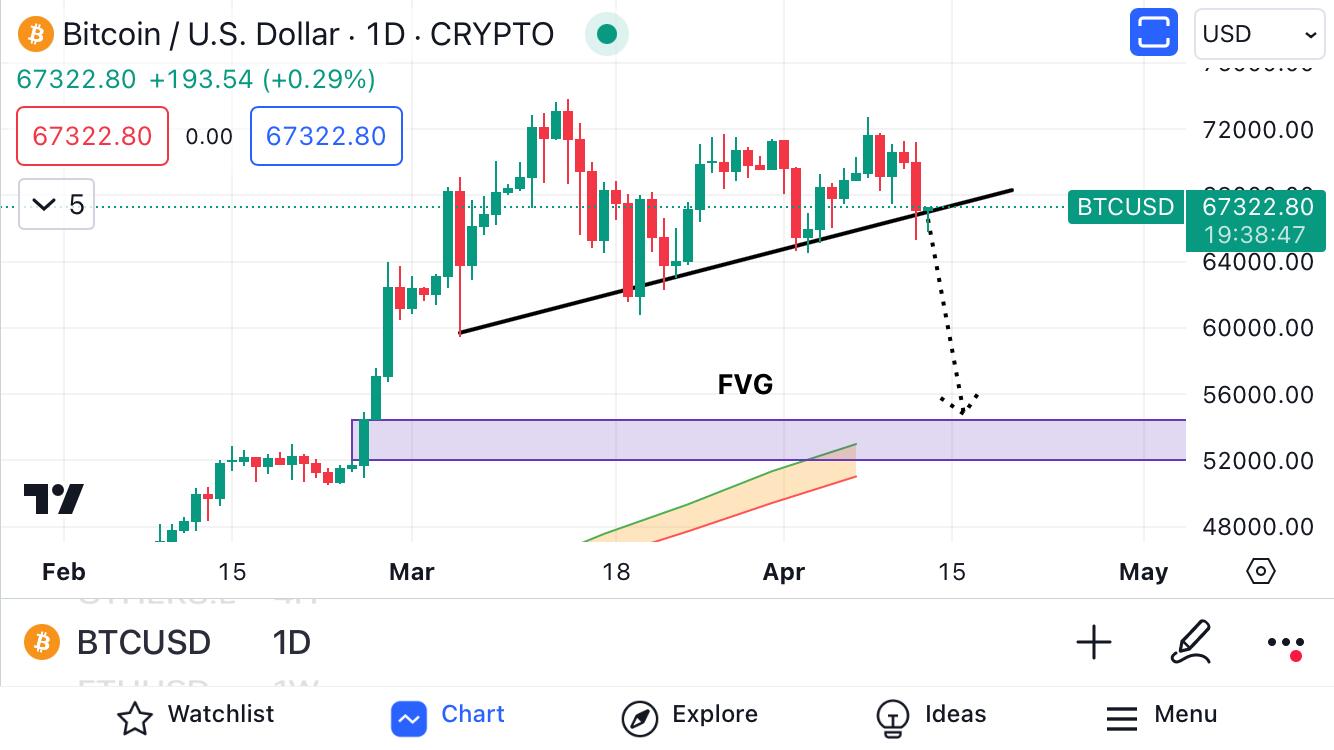
#Bitcoin still hasn’t mitigated the Fair Value Gap, and has yet to test the Bull Market Support Band.
It’s possible that this $BTC correction is not over yet. DCA in is the name of the game. 
Yeah sure, #Bitcoin is testing this diagonal support line, BUT there still are multiple FVG’s below to be filled.
It would make sense for $BTC to fill these FVG’s, as they also correlate with the bull market support band.
However, in case #BTC doesn’t fill these FVG’s, consider DCA a small amount.