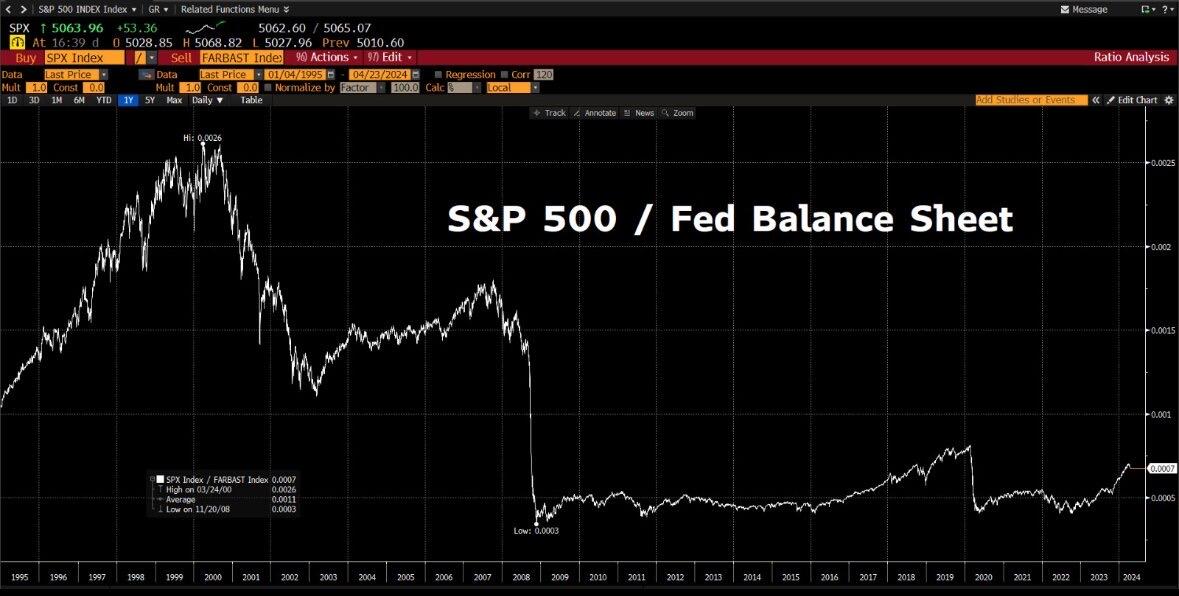
FINANCIAL GRAVITY:

If we divide the performance of the S&P 500 by the Fed’s Balance Sheet since the GFC, the LINE IS FLAT.

This means that there has been basically NO REAL growth in stock prices since 2008- with the only rise in prices due to money printing.

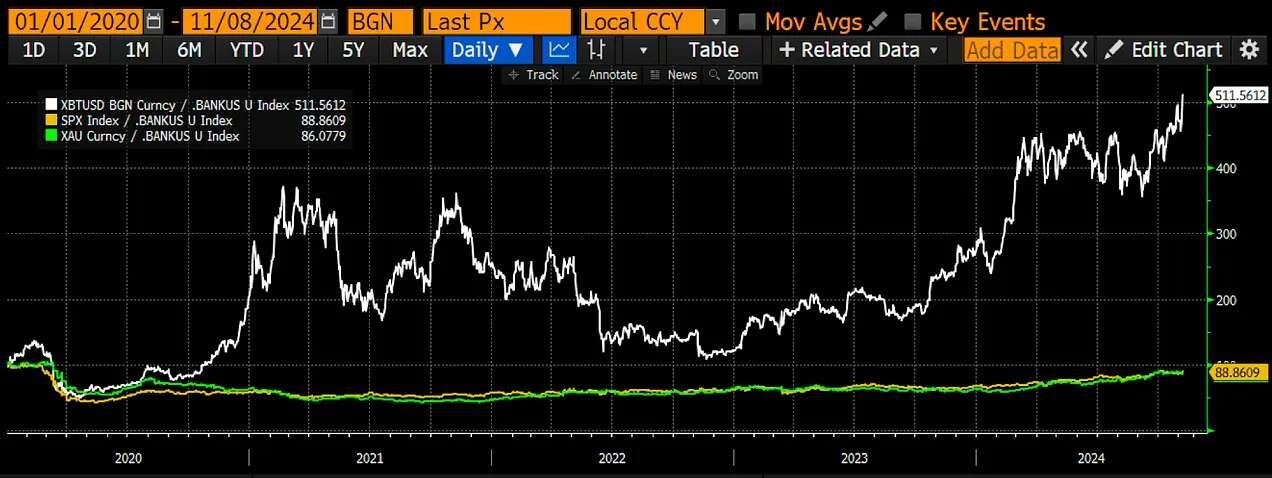
The correlation coefficient between central bank quantitative easing and the price of stock indexes is nearly 1.

The money printed by the Fed, because of the structure of the Open Market Operations, is plugged directly into the Treasury markets, and from there, flows into equities and derivatives.

This has served to primarily enrich the asset owners, financial institutions, and wealthy elites who own the majority of the stock market anyways.

The entire rally has been an illusion, financed by the Fed and maintained through QE.

In the black expanse of space, many things are not what they seem.

Reply to this note

Please Login to reply.

Discussion

Yes and there is inflation as a result but the rich don’t give a fuck bc their net worth went up by another 10 mil while their expenses went up another 100k. Easy trade off for them

Correlation coefficient of nearly 1 in a regression is not great. If the s&p returns swing up, and correlation not there, the return won’t be good. You really need it to be >1. I’m not an analyst nor an investor, just studied finance recently and find the topic interesting.

You want the beta slope to be >1 in regression against s&p for capm. This tells you the change in the expected value of Yi corresponding to a 1-unit increase in Xi.

Whats even worse is stonks havent even reached their ATH vs gold since the Y2K crash even with all this printing.

#everythingisashitcoin

Arthur Hayes had a similar chart on one of his recent substacks that adds in btc to the same chart to really highlight the difference in growth:

Full article & discussion:

https://substack.com/@cryptohayes/p-151515391