
I never understood what that scaling is?
Discussion

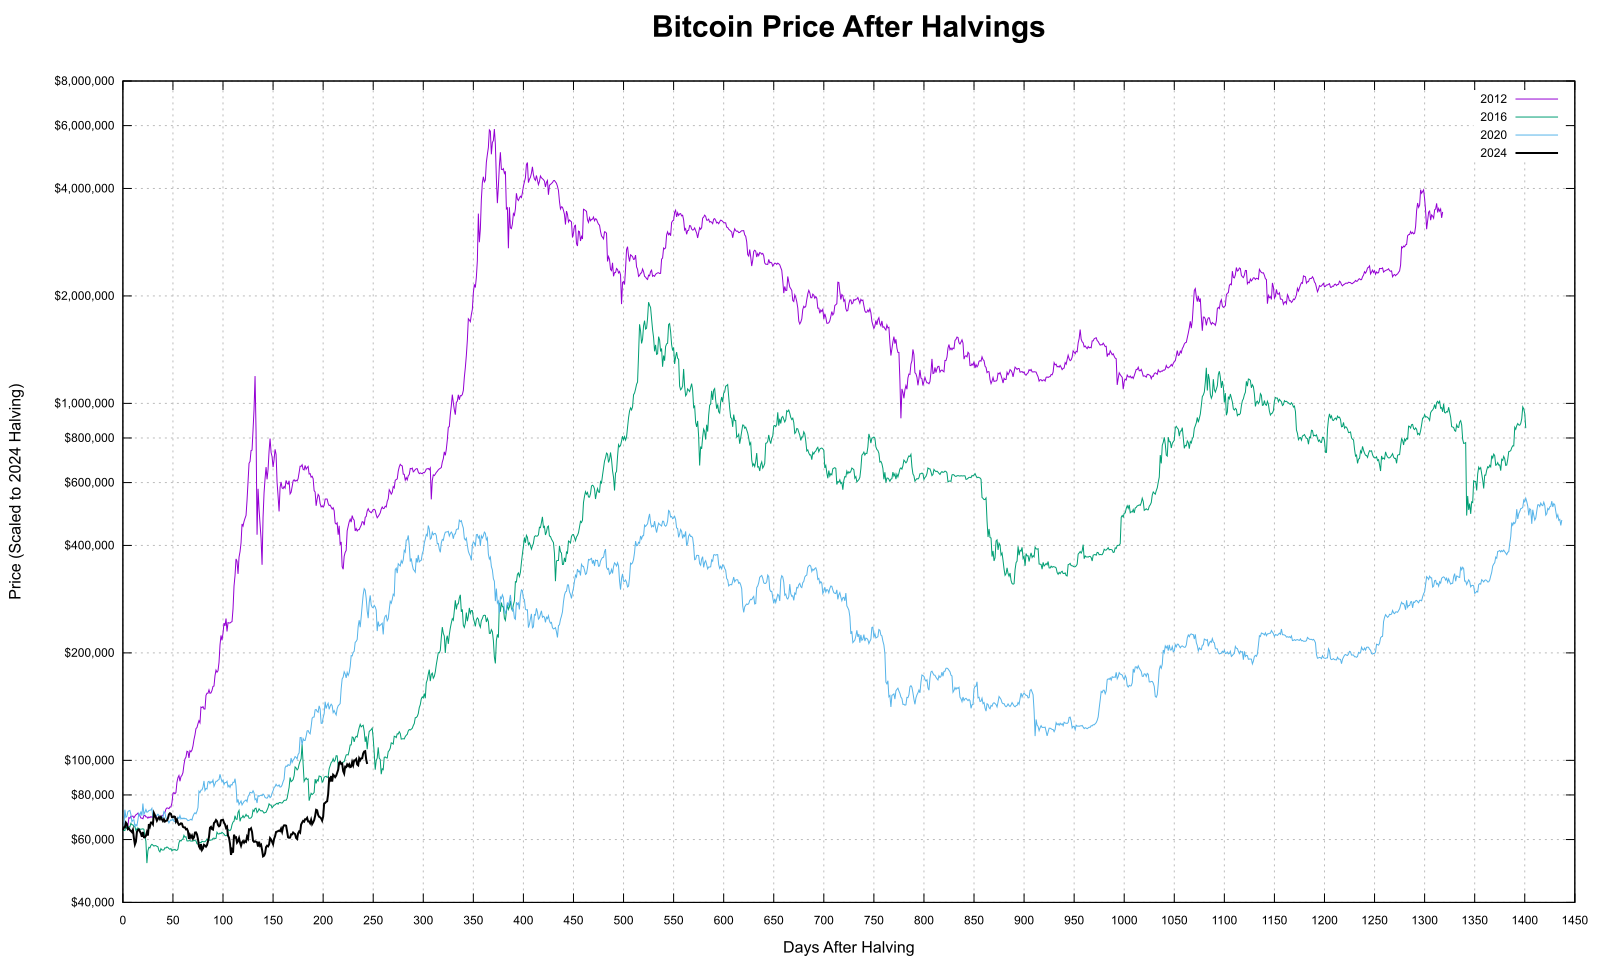
The y-axis is dollars, x-axis days after halving; the colors are the cycles (we are in the black one). We can interpret the curves as: the value of the current cycle scaled by another cycle
I never understood what that scaling is?
The y-axis is dollars, x-axis days after halving; the colors are the cycles (we are in the black one). We can interpret the curves as: the value of the current cycle scaled by another cycle