I dont agree, we are absolutely earlier that that, pretty no one uses bitcoin today. Still, at some point it will return to accelerate, maybe really at next cicle? (but with that sigma curve a lot shifted to the left)
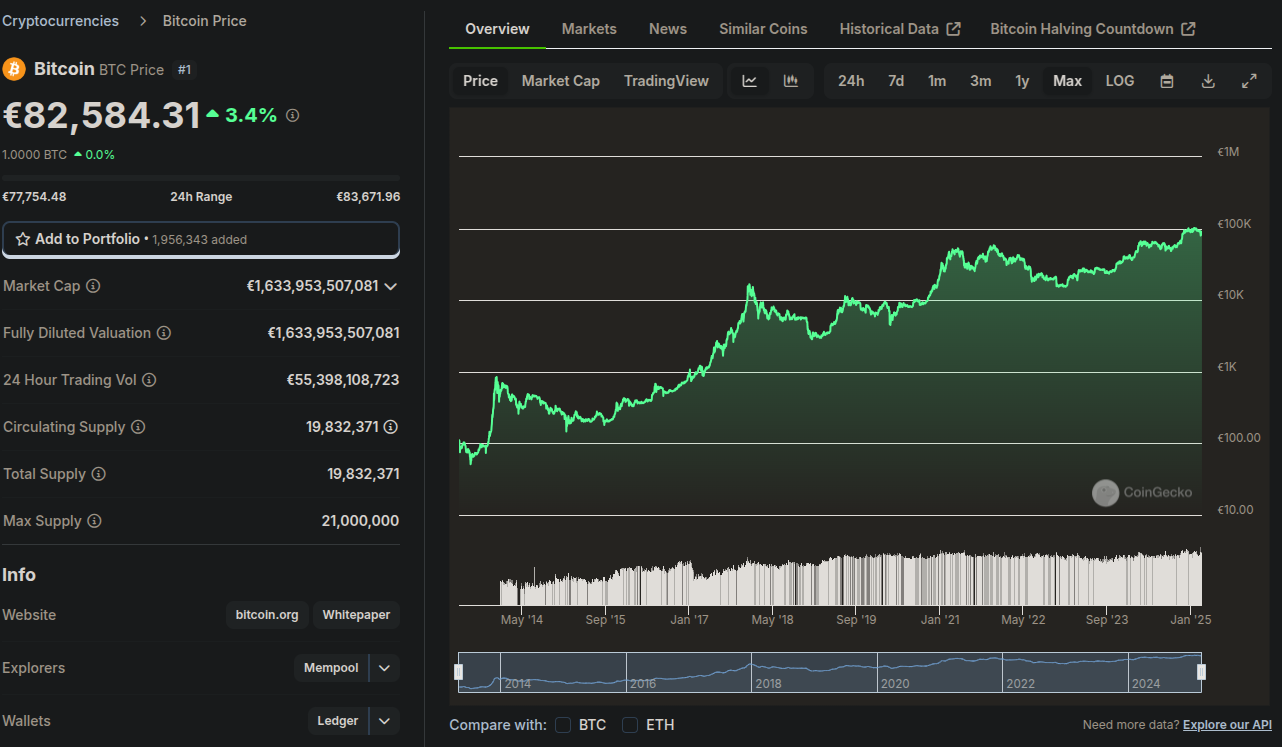
this chart tracks approximately 3 of bitcoin's halving cycles, starting in around 2013, until now
notice how in the 1/3rds of the period it each time reaches a new high that coincidentally is also the log10? 1000, 10,000, now 100,000
the cycle curve looks like it's getting slower but i think that's because it's an adoption sigma curve, which looks sharper at the beginning and when it reaches the middle point... here is an example
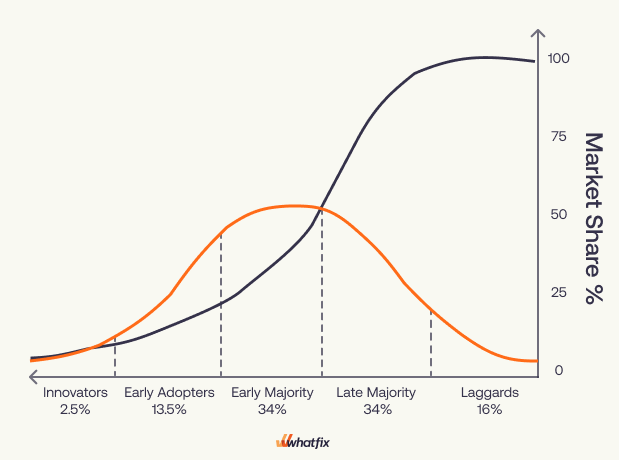
https://whatfix.com/blog/technology-adoption-curve/
it's a sigma, and when it reaches the point where it starts to decelerate (which we are seeing now( this is just before the point at which the technology penetrates broadly and becomes ubiquitous
so, you would expect it will sharply rise in the first cycle, slow down a bit in the second, and seem to almost stall in the third, and then in the coming cycle, which is the 4th after the ones in the price chart, it sharply goes up again
which is why i think we could see $1,000,000 bitcoin before the next 3 years passes
i wish it wolud come sooner but i'll be able to stack enough anyway to get my boat within the next 6 months anyhow, that's enough for me, a lot of new things to learn when i get to that