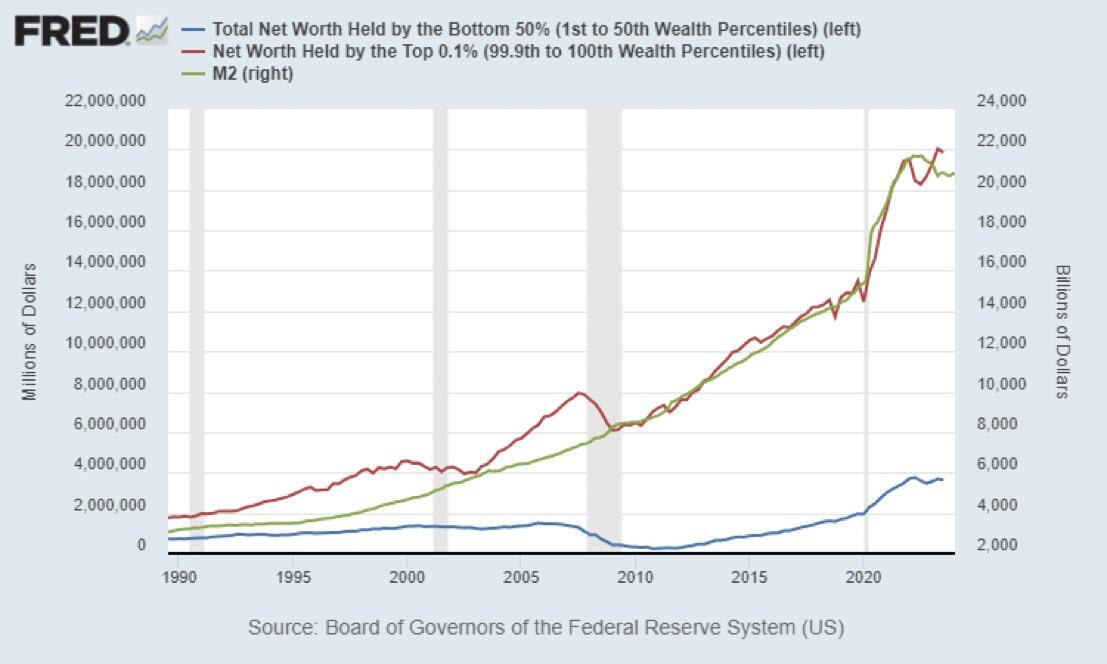
The Cantillon Effect clearly illustrated in a chart.
Money supply (M2) and wealth in the hands of the top 0.1% in the U.S. have gone hand in hand since the 1990s.
Meanwhile, the amount of money in the hands of the bottom 50% remains almost unchanged.
The rich get richer, and the poor get poorer.
Amazing. The ones near to the money printer benefit the most, while the bottom end gets diluted.
Please Login to reply.
No replies yet.