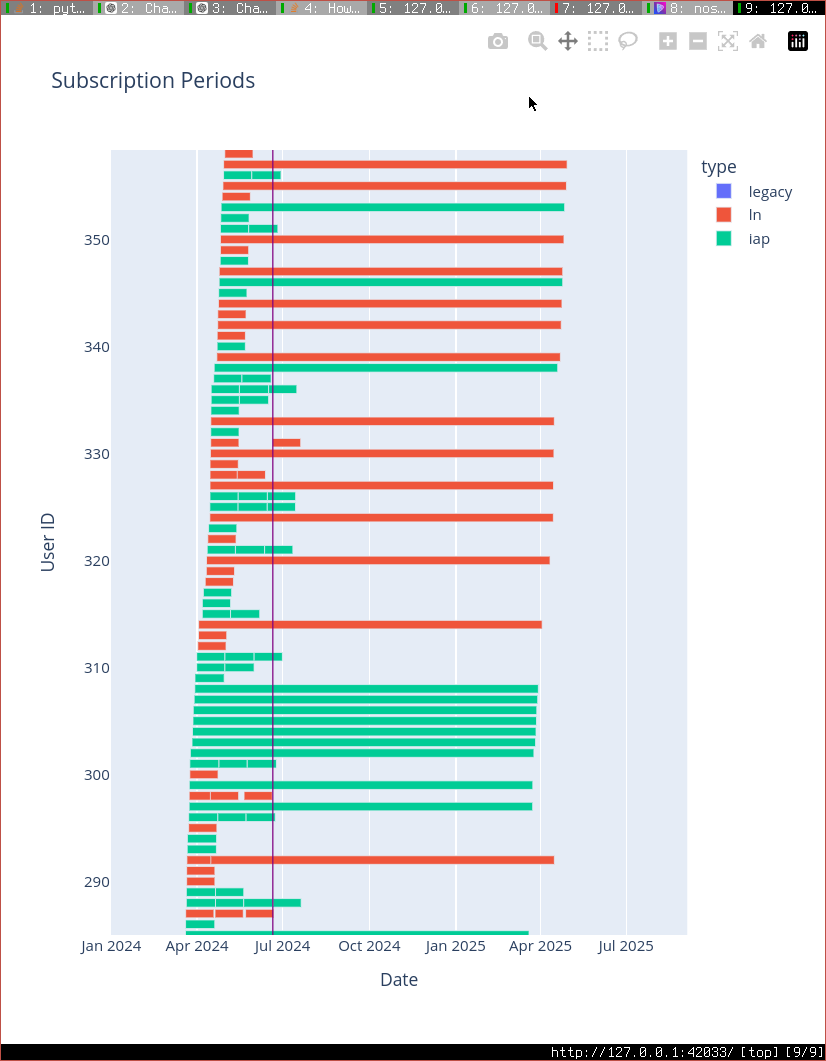
Wasn’t sure the best way to visualize our subscription data, so I gave a very small sample to chatgpt (just sub#, no pubkeys, just start and end dates), and it suggested a gantt chart. Very cool. Not sure I would have thought of this. It even wrote all of the python code and used a library called plotly which i never used before. thank you gpt sensei.
I wonder if Venice.ai could do the same for you. So we can stop feeding the chat gpt overlord
Please Login to reply.
No replies yet.