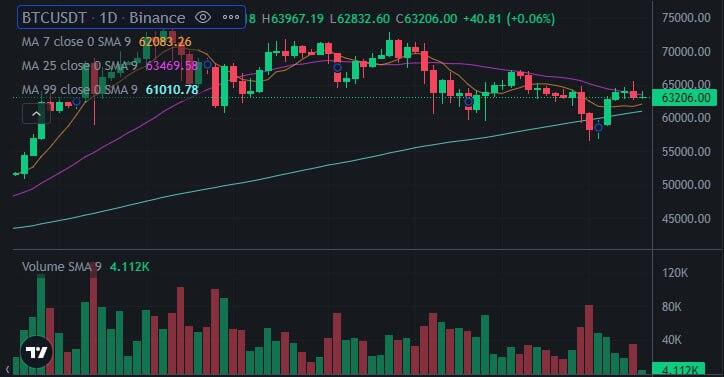
At present, the 5-day SMA, 10-day SMA, 20-day SMA, 60-day SMA, 120-day SMA, 250-day SMA are all arranged in a bullish manner, with a clear bullish trend
From the Bollinger Band chart, the current price is running near the upper rail line, the width of the Bollinger Band is narrower, which indicates that the price is in a strong oscillation phase
At present, the MACD line and the signal line are all in a long alignment, and the MACD indicator is in a long trend
Currently the K line, D line and J line are all in a long alignment, KDJ indicator is in a long trend
Currently BTC price is in a strong oscillator phase with a clear long trend #nostr #bitcoin