The support level is the level at which the price may bounce, while the resistance level is the level at which the price may fall. We can see the support level near $60,000 and the resistance level near $70,000
The SMA is the average level of the price. We can see the 50-day SMA and the 200-day SMA. the 50-day SMA is the average of the price over the last 50 days, while the 200-day SMA is the average of the price over the last 200 days.
The price of BTC may continue to fall in the short term and may fall further if the price falls below $60,000 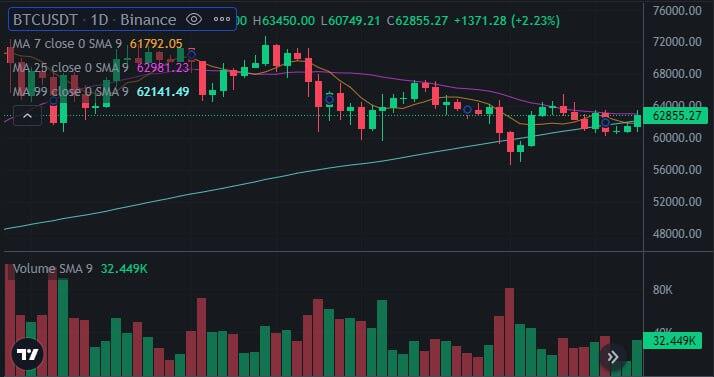
At present, the 5-day SMA, 10-day SMA, 20-day SMA, 60-day SMA, 120-day SMA, 250-day SMA are all arranged in a bullish manner, with a clear bullish trend
From the Bollinger Band chart, the current price is running near the upper rail line, the width of the Bollinger Band is narrower, which indicates that the price is in a strong oscillation phase
At present, the MACD line and the signal line are all in a long alignment, and the MACD indicator is in a long trend
Currently the K line, D line and J line are all in a long alignment, KDJ indicator is in a long trend
Currently BTC price is in a strong oscillator phase with a clear long trend #nostr #bitcoin 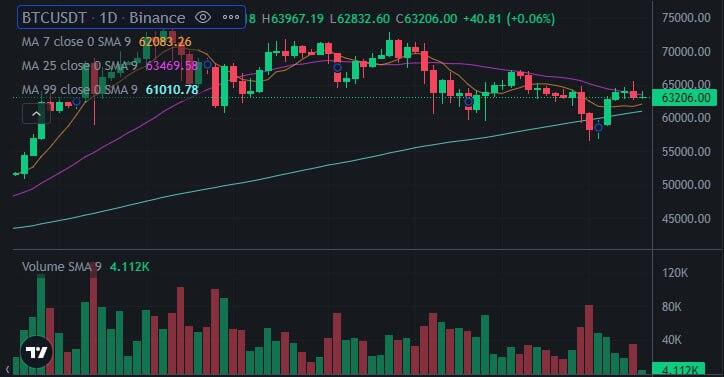
The SMA indicators show that BTC's 5-day SMA, 10-day SMA and 20-day SMA are currently in a long alignment, with the 5-day SMA and 10-day SMA having formed a golden fork and the 20-day SMA about to form a golden fork with the 5-day SMA and 10-day SMA. SMA indicators show that BTC is currently in a long trend
The MACD indicator shows that BTC's MACD line and signal line are both above the 0-axis, and the MACD line is forming a golden cross with the signal line.The MACD indicator shows that BTC is currently in a bullish trend
The RSI indicator for BTC is currently located near 50, showing that BTC is currently overbought. However, BTC's RSI indicator has been oscillating around 50 for the past month, showing that BTC is currently in a relatively stable state
BTC is currently in a long trend, but since the RSI indicator shows that BTC is currently in an overbought state, the price of BTC could see a pullback in the short term. If BTC price falls below $60,000, it could fall further to near $55,000. However, if BTC price is able to hold onto $60,000, it could continue to rise to near $64,800 #nostr #bitcoin 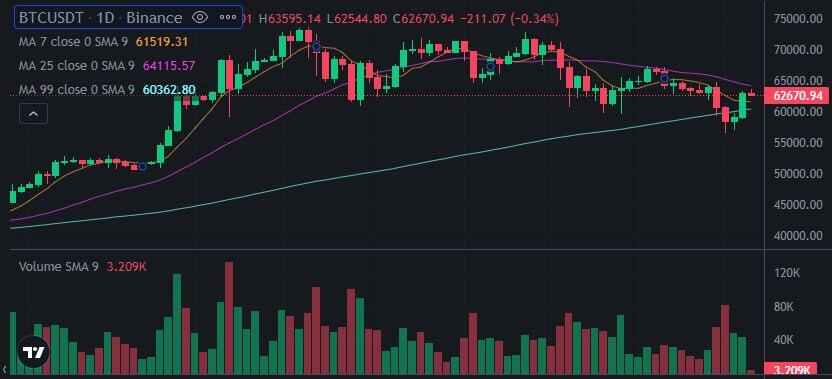
BTC is up 4.7% in the last 24 hours and is currently trading at $63,500. Bitcoin has gained 10 percent in the past week and 20 percent in the past month
BTC is currently testing its 200-day moving average, which currently sits around $64,000. If BTC is able to break above this level, it could rise further to $7,000. However, if Bitcoin fails to break above this level, it could fall back to $60,000
The Relative Strength Index (RSI) for BTC is currently at 60, indicating that BTC is currently overbought. This could mean that Bitcoin is due for a pullback in the short term
Bitcoin's current uptrend remains strong, but a pullback is possible in the short term
#nostr #bitcoin 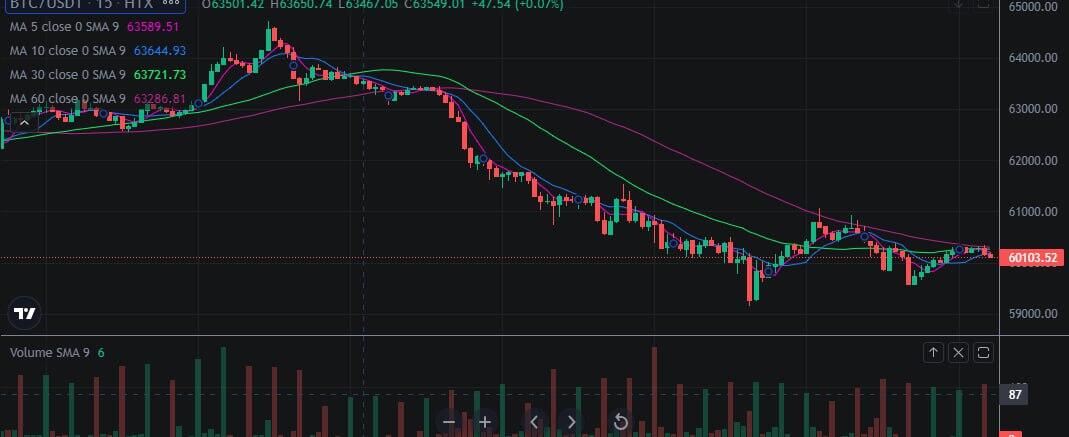
The 5-day SMA, 10-day SMA, 30-day SMA and 60-day SMA are all in a long alignment, and the 5-day SMA, 10-day SMA and 30-day SMA have all penetrated the 60-day SMA, the long trend is established
The upper Bollinger Band, middle rail and lower rail are all in a multi alignment, and the price is running near the upper Bollinger Band, the long trend is established
The MACD indicator's red kinetic column continues to shorten, the green kinetic column continues to grow, and the MACD indicator line has crossed the 0-axis, the bullish trend is established
KDJ indicator's K line, D line, J line have gone through 50, and K line, D line have gone through 80, the long trend is established
The RSI value of the RSI indicator has gone up through 70, and the RSI indicator line has gone up through 80, the long trend is established
BTC is currently in a bullish trend, investors can buy on the low side and sell on the high side #nostr #bitcoin 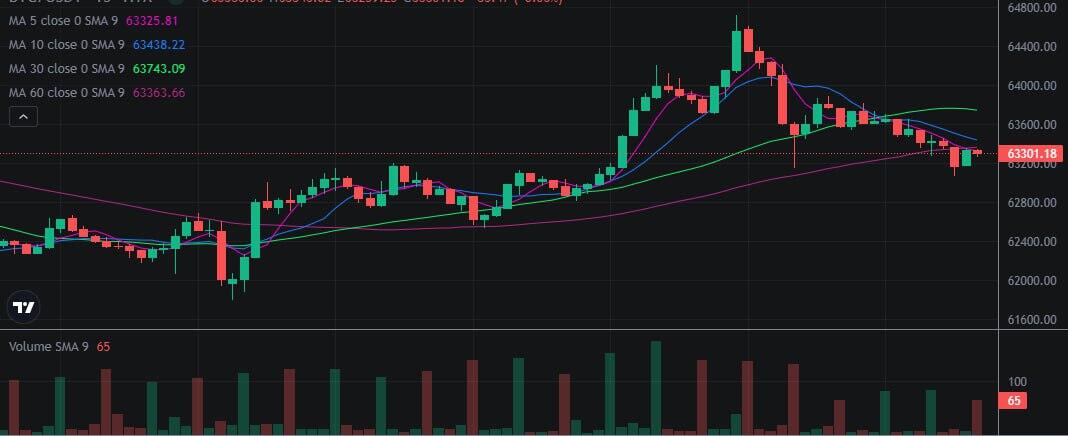
The 5-day SMA is a short-term SMA, which has a greater impact on short-term price movements. 10-day SMA is an intermediate-term SMA, which has a greater impact on intermediate-term price movements. 20-day SMA is a long-term SMA, which has a greater impact on long-term price movements. 60-day SMA, 120-day SMA, 250-day SMA are long-term SMAs, which have a greater impact on long-term price movements
The MACD indicator is used to measure the momentum of the BTC price movement.The MACD indicator consists of two lines, one is the MACD line and the other is the signal line.When the MACD line and the signal line are above the 0-axis, it indicates that the price is in a long market, and when they are below the 0-axis, it indicates that the price is in a short market. When the MACD line diverges from the signal line, it indicates a possible price reversal
The KDJ indicator is used to measure the strength of the BTC price movement. the KDJ indicator consists of three lines, one is the K line, one is the D line, and the other is the J line. the K, D, and J lines above the 0 axis indicate that the price is in a strong market, while below the 0 axis indicates that the price is in a weak market. When the K, D and J lines diverge, it indicates a possible price reversal
The RSI indicator is used to measure overbought and oversold BTC price action.The RSI indicator takes values between 0 and 100. When the value of the RSI indicator is above 70, it means that the price is overbought, and below 30, it means that the price is oversold. When the value of the RSI indicator is near 50, it means that the price is in equilibrium
The Bollinger Bands indicator is used to measure the trend of BT price action. The Bollinger Bands indicator consists of three lines, one is the center rail line, another is the upper rail line, and another is the lower rail line. The center rail line is the average price of the stock, the upper rail line is the highest price of the price and the lower rail line is the lowest price of the price. When the price is near the upper line, it means that the price is in a strong market, and when it is near the lower line, it means that the price is in a weak market. When the price is near the center line, it means the price is in equilibrium
BTC is currently in an oscillatory consolidation phase. The stock price is oscillating around the 5-day SMA, 10-day SMA and 20-day SMA, and the MACD indicator, KDJ indicator, RSI indicator and Bollinger Bands indicator all show that the price is in a state of oscillation, waiting for the price to break out of the oscillation range before making further moves #nostr #Bitcoin 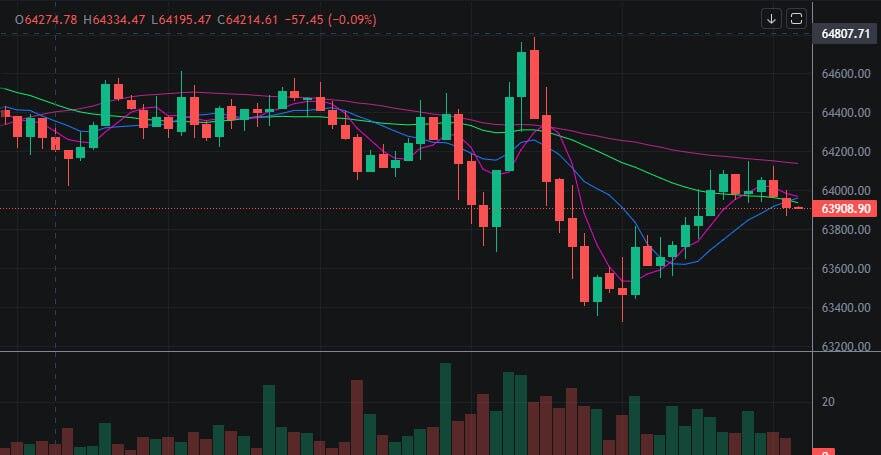
By looking at the price chart, we can see that the price has a support level near $64,000 and a pressure level near $66,000. Price has a bounce near the support level and a pullback near the pressure level. This indicates that price is going long near $64,000 and short near $66,000
The Bollinger Bands indicator can be used to identify support and pressure levels for price. The Bollinger Band indicator is made up of three lines, the upper, middle and lower rail lines. The upper and lower lines are the pressure and support levels of the price. The middle rail line is the average of the price. When the price is near the upper Bollinger Band line, it means that the price is in an overbought state, and when the price is near the lower Bollinger Band line, it means that the price is in an oversold state
The KDJ indicator can be used to determine the trend of the price, the KDJ indicator is composed of three lines, respectively, K line, D line and J line. K line is the price of the fast line, D line is the price of the slow line, J line is the price of the deviation line. When the K and D lines are both up, the price trend is up, and when the K and D lines are both down, the price trend is down. When the J line is at a high level, the price is overbought, and when the J line is at a low level, the price is oversold
Use the MACD indicator to determine price momentum.The MACD indicator is made up of two lines, the MACD line and the signal line.The MACD line is the fast line of price and the signal line is the slow line of price. When the MACD line and the signal line are both up, it means price momentum is up, and when the MACD line and the signal line are both down, it means price momentum is down. When the MACD line and the signal line diverge, it indicates a possible reversal of the price trend
Use the volume indicator to determine price volume. The volume indicator is an indicator that reflects the volume of price transactions. When volume increases, it indicates an increase in price trading volume, and when volume decreases, it indicates a decrease in price trading volume. When volume and price rise at the same time, it indicates that the price trend is upward, and when volume and price fall at the same time, it indicates that the price trend is downward
These indicators can be used to analyze the price trend. By analyzing the price chart, the Bollinger Band indicator, the KDJ indicator, the MACD indicator and the volume indicator, we can see that the price is going long near $64,000 and short near $66,000 #nostr #bitcoin 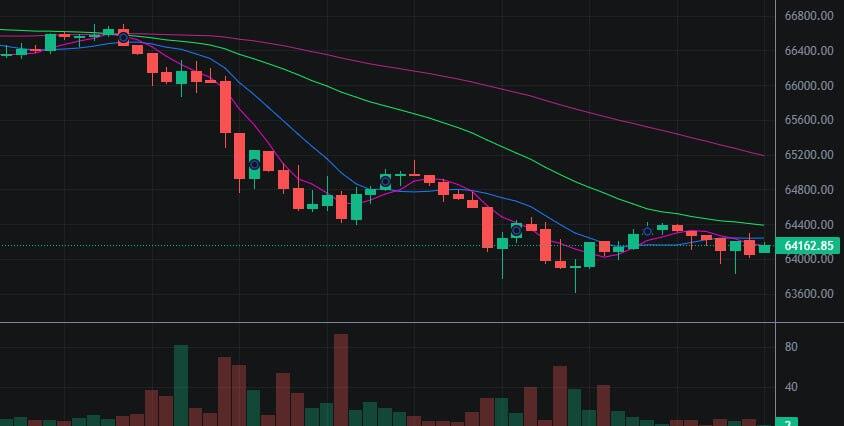
As you can see from the trend chart, volume is increasing as prices rise. This shows that the bulls are controlling the market and there is strong buying interest. The price has broken above the previous high and is continuing to rise. macd indicator is also showing strong bulls. The trend is rising #nostr #bitcoin 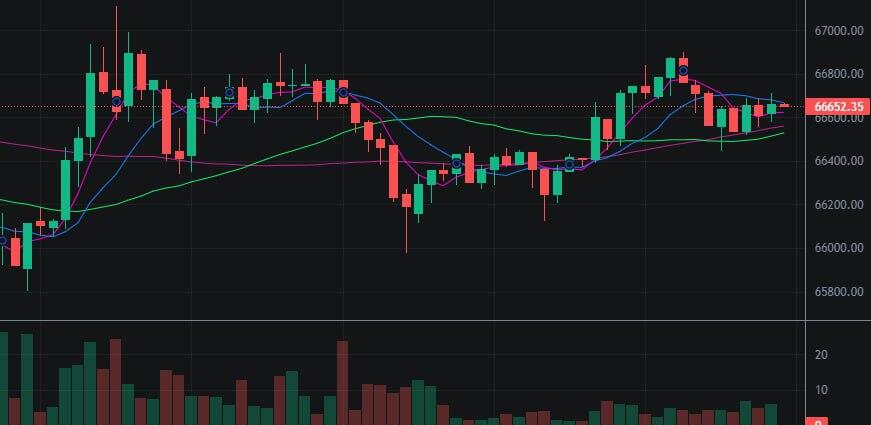
The Bollinger Bands indicator consists of three lines, the upper, middle and lower rail lines. The upper and lower rail lines are calculated based on the price volatility of a certain period in the past, and the middle rail line is the average price of a certain period in the past. When the price is running near the upper rail line, it means that the price is in an overbought state and may retrace; when the price is running near the lower rail line, it means that the price is in an oversold state and may rebound
The RSI indicator is a measure of price momentum, taking values between 0 and 100. When the RSI indicator is greater than 70, that the price is in an overbought state, there may be a pullback; when the RSI indicator is less than 30, that the price is in an oversold state, there may be a rebound
Deviation indicator is a measure of price and technical indicators of the degree of divergence between the indicators. When the price and technical indicators divergence, that the price may be about to undergo a reversal
Volume is a measure of how actively the market is trading. When the volume increases, it means that the market is actively traded and the price may be about to rise; when the volume decreases, it means that the market is not actively traded and the price may be about to fall
According to the trend chart of the rise and fall to make a judgment. When the price is running near the upper rail line, RSI indicator is greater than 70, divergence indicator divergence, volume increased, that the price may be about to fall #nostr #bitcoin 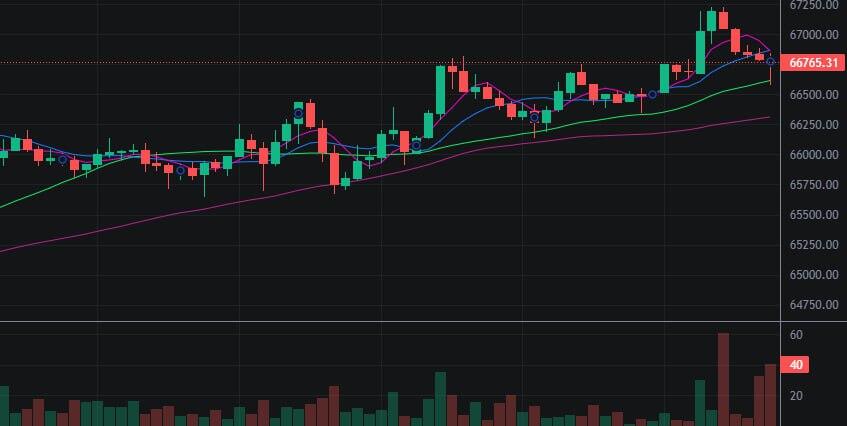
After BTC was halved, the price experienced a wave of gains and then pulled back to consolidate. Currently, the price is running above the 5-day SMA, and the macd indicator is about to gold fork, showing that the bullish force is increasing. Therefore, we can judge that the price will continue to rise after BTC halving 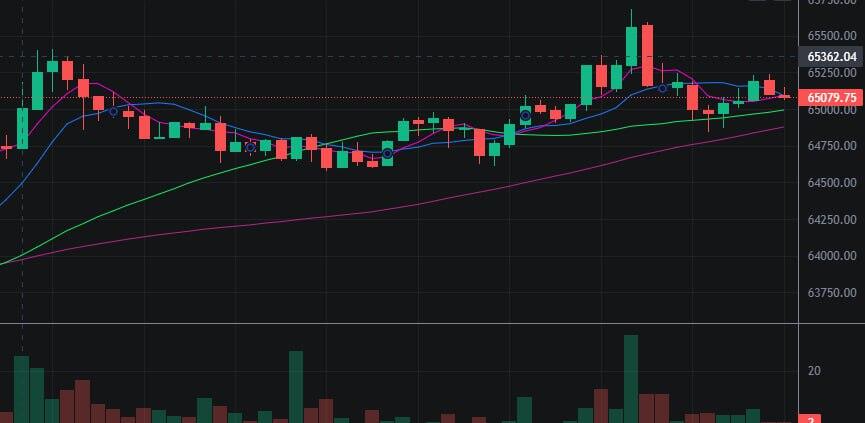
BTC is in a downtrend near $62,086. In addition, the MACD indicator is also showing a bearish signal as the red bars are increasing.The RSI indicator is also showing a bearish signal and is currently sitting below 50. Therefore, BTC is in a downtrend #nostr #bitcoin 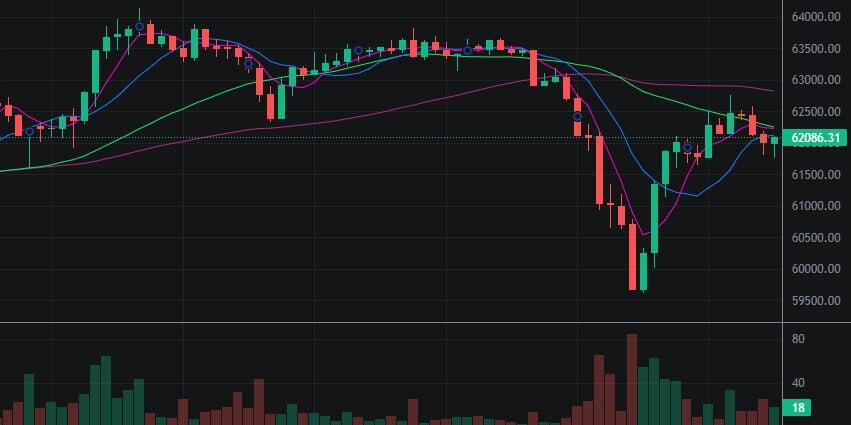
BTC has been rising over the past 24 hours. It rose from a low of around $6,2000 to a high of around $6,4500
It has been around the $6,3000 level and the BTC price is currently overbought
The stochastic indicator is overbought when it is above 80 and oversold when it is below 20. The stochastic indicator is currently trading around 85, suggesting that a pullback in price may be imminent
BTC is currently in a bullish state as indicated by the MACD indicator, which consists of two lines, one fast and one slow. When the fast line is above the slow line, the price is in a bullish state. When the fast line is below the slow line, the price is in a bearish state. the MACD indicator is currently above the 0 line, suggesting that a rise in the price may be imminent
The Bollinger Bands indicator shows that BTC is currently in an oscillator. The Bollinger Bands indicator consists of three lines, an upper rail, a middle rail and a lower rail. When the price is between the upper and middle Bollinger Band, it means that the price is in a state of oscillation. When the price is between the middle and lower Bollinger Bands, it means that the price is falling. When the price is between the upper Bollinger Band and the upper rail, the price is in an uptrend. The Bollinger Band indicator is currently located near the middle rail, indicating that a price shock may be imminent
BTC has been rising over the past 24 hours. The price rose from a low of around $6,2000 to a high of around $6,4500. It has been fluctuating around the $6,3000 level. The stochastic indicator shows that BTC is currently overbought and the MACD indicator shows that BTC is currently bullish. The Bollinger Band Indicator shows that the price of Bitcoin is currently in an oscillator #bitcoin #nostr 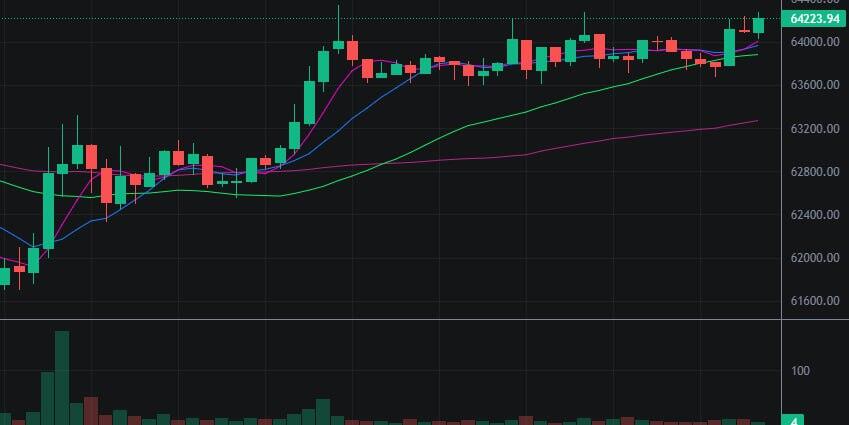
The MACD indicator consists of two lines, one is the MACD line, the other is the signal line, the MACD line and the signal line in the 0 axis above, indicates that the long side is strong; in the 0 axis below, indicates that the short side is strong
KDJ indicator consists of three lines, respectively, K line, D line and J line. K and D lines in 20 above, said overbought; in 80 below, said oversold
RSI indicator is a relative strength indicator, it reflects the price in a certain period of time, the degree of increase or decrease. RSI indicator in more than 70, said overbought; in 30 below, said oversold
The Bollinger Bands indicator consists of three lines, the upper rail, the middle rail and the lower rail. The Bollinger Bands indicator reflects the range of price fluctuations. When the price is near the upper Bollinger Band line, it indicates that the price may be facing a correction; when the price is near the lower Bollinger Band line, it indicates that the price may be facing a rebound
When the averaging system, MACD indicator, KDJ indicator and RSI indicator all show long strength, we can assume that the trend chart will continue to rise; when the averaging system, MACD indicator, KDJ indicator and RSI indicator all show short strength, we can assume that the trend chart will continue to decline
Technical analysis is not a panacea, it can only help us to increase the winning percentage of our trades. There are other factors that we should consider when trading, such as fundamental analysis, financial analysis and market sentiment #bitcoin #nostr 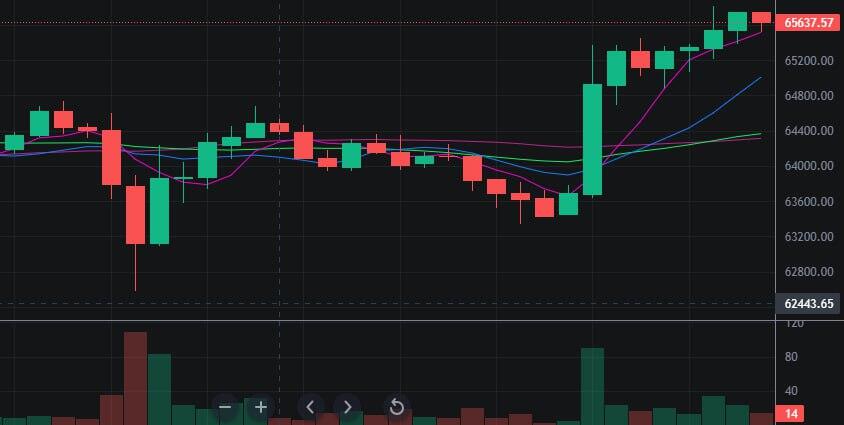
MACD indicator is to determine the stock up and down momentum indicator. When the MACD indicator is above the 0 axis, it means that the stock is in the long market, the stock price has upward momentum; when the MACD indicator is below the 0 axis, it means that it is in the short market, the stock price has downward momentum
KDJ indicator is to determine the trend of stocks up or down. When the KDJ indicator is at a high level, it means that the stock price is in an overbought state, and there is a risk of falling; when the KDJ indicator is at a low level, it means that it is in an oversold state, and there is a potential to rise
RSI indicator is to determine the stock momentum indicator. When the RSI indicator is at a high level, it indicates that the stock price is in an overbought state, and there is a risk of decline; when the RSI indicator is at a low level, it indicates that it is in an oversold state, and there is a potential for growth
The Bollinger Bands indicator is an indicator for determining the upward and downward trend of a stock. When the stock price is running above the Bollinger Bands, it means that the stock price is in an uptrend; when the stock price is running under the Bollinger Bands, it means that it is in a downtrend
The combination of the above indicators shows that it is currently in a downtrend. The SMA system shows that the 5-day SMA, 10-day SMA, 20-day SMA, and 60-day SMA are all down, indicating a downtrend.The MACD indicator shows that the MACD indicator is below the 0-axis, indicating that it is in a short market, and that the stock has downward momentum.The KDJ indicator shows that the KDJ indicator is at a low level, indicating that the stock is in an oversold state, and that it has the potential for an upturn.The RSI indicator shows that the RSI indicator is at a low level, indicating that the stock is in an oversold state, and that it has the potential for an upturn. The RSI indicator shows that the RSI indicator is at a low level, indicating an oversold condition with upside potential. The Bollinger Bands indicator shows that the stock is running under the Bollinger Bands, indicating a downtrend
BTC is currently in a downtrend, but there are signs of a rebound. Investors can buy on the low side, but be careful to control the position, stop loss set at $63,000 #bitcoin #nostr 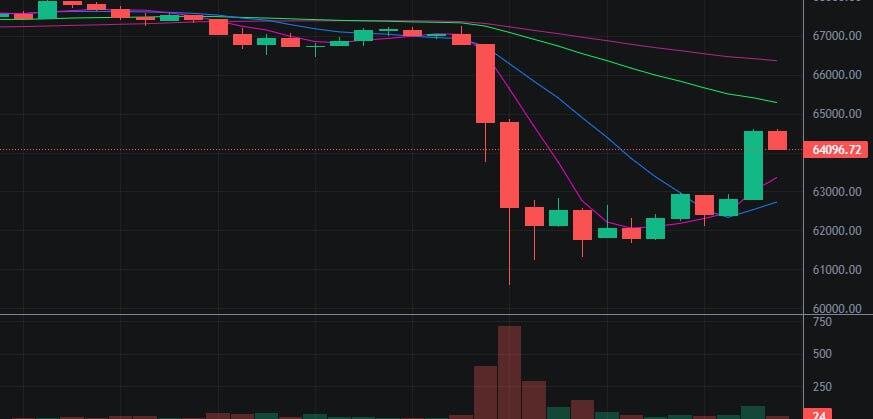
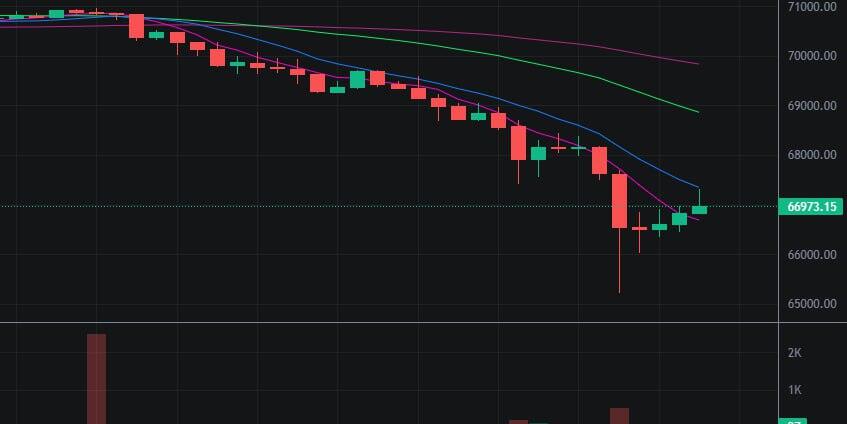
The price of Bitcoin has plummeted in the last 24 hours. The price fell from a high of $70,000 to a low of $66,000, a drop of more than 5%, with the price of Bitcoin at $66,973.15
The upper and lower Bollinger Bands represent the high and low points of the price, respectively, while the middle line represents the average of the price. When the price is close to the upper Bollinger Band line, the price may be overbought, and when the price is close to the lower Bollinger Band line, the price may be oversold.
The RSI indicator shows how strong or weak the price has been over the past period of time. the RSI indicator takes values between 0 and 100. when the RSI indicator is close to 100, it means that the price may have been overbought, and when the RSI indicator is close to 0, it means that the price may have been oversold.
The divergence indicator shows the relationship between price and the indicator. When the price is rising and the indicator is falling, or when the price is falling and the indicator is rising, it indicates that a price reversal may be imminent.
The SMA indicator shows the average of prices over time. The SMA indicator can help investors identify price trends. When the price is moving above the SMA, it indicates an upward price trend, and when the price is moving below the SMA, it indicates a downward price trend.
If selling pressure continues to build, or if more negative news emerges, then the price could fall further #bitcoin #nostr