
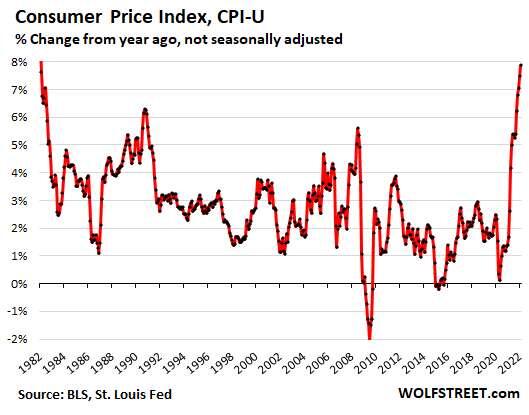
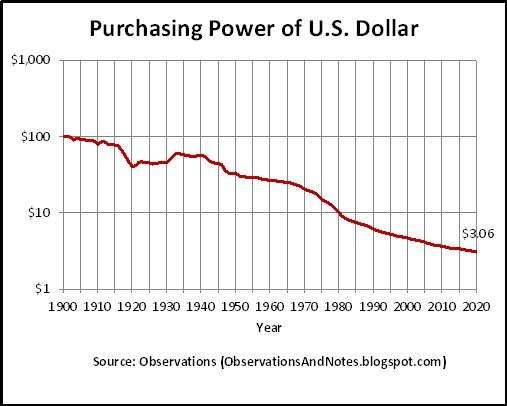
Just need a chart that shows % drop each year instead of cumulative lose of value over time or cpi and real cpi overlaying purchasing power drop on log scale.
Someone should clean one up from 1900 to 2024
Just need a chart that shows % drop each year instead of cumulative lose of value over time or cpi and real cpi overlaying purchasing power drop on log scale.
Someone should clean one up from 1900 to 2024
