
Yes, though no chart exist relevant to the price of Bitcoin AFAIK, but here is a repost from last month with a link to Nostr stats.
Discussion

I see what you mean!
I agree with what's said in the previous post. The nature of what nostr is working on is almost garuanteed to be spikey.
People don't seem to wake up gradually. They wait until some event destroys their way of life before looking for alternatives. For some people that never happens and they just go with the biggest network.
I hope as the clown world continues to escalate with control/censorship, it will create more waves of people waking up and coming over at once.
In between maybe its normal to trend down while the clown world is relatively calm.

Yeah, so, it's gotten worse.
I can literally feel the decline because I don't usually post about Bitcoin and it's like 🦗🦗🦗🦗
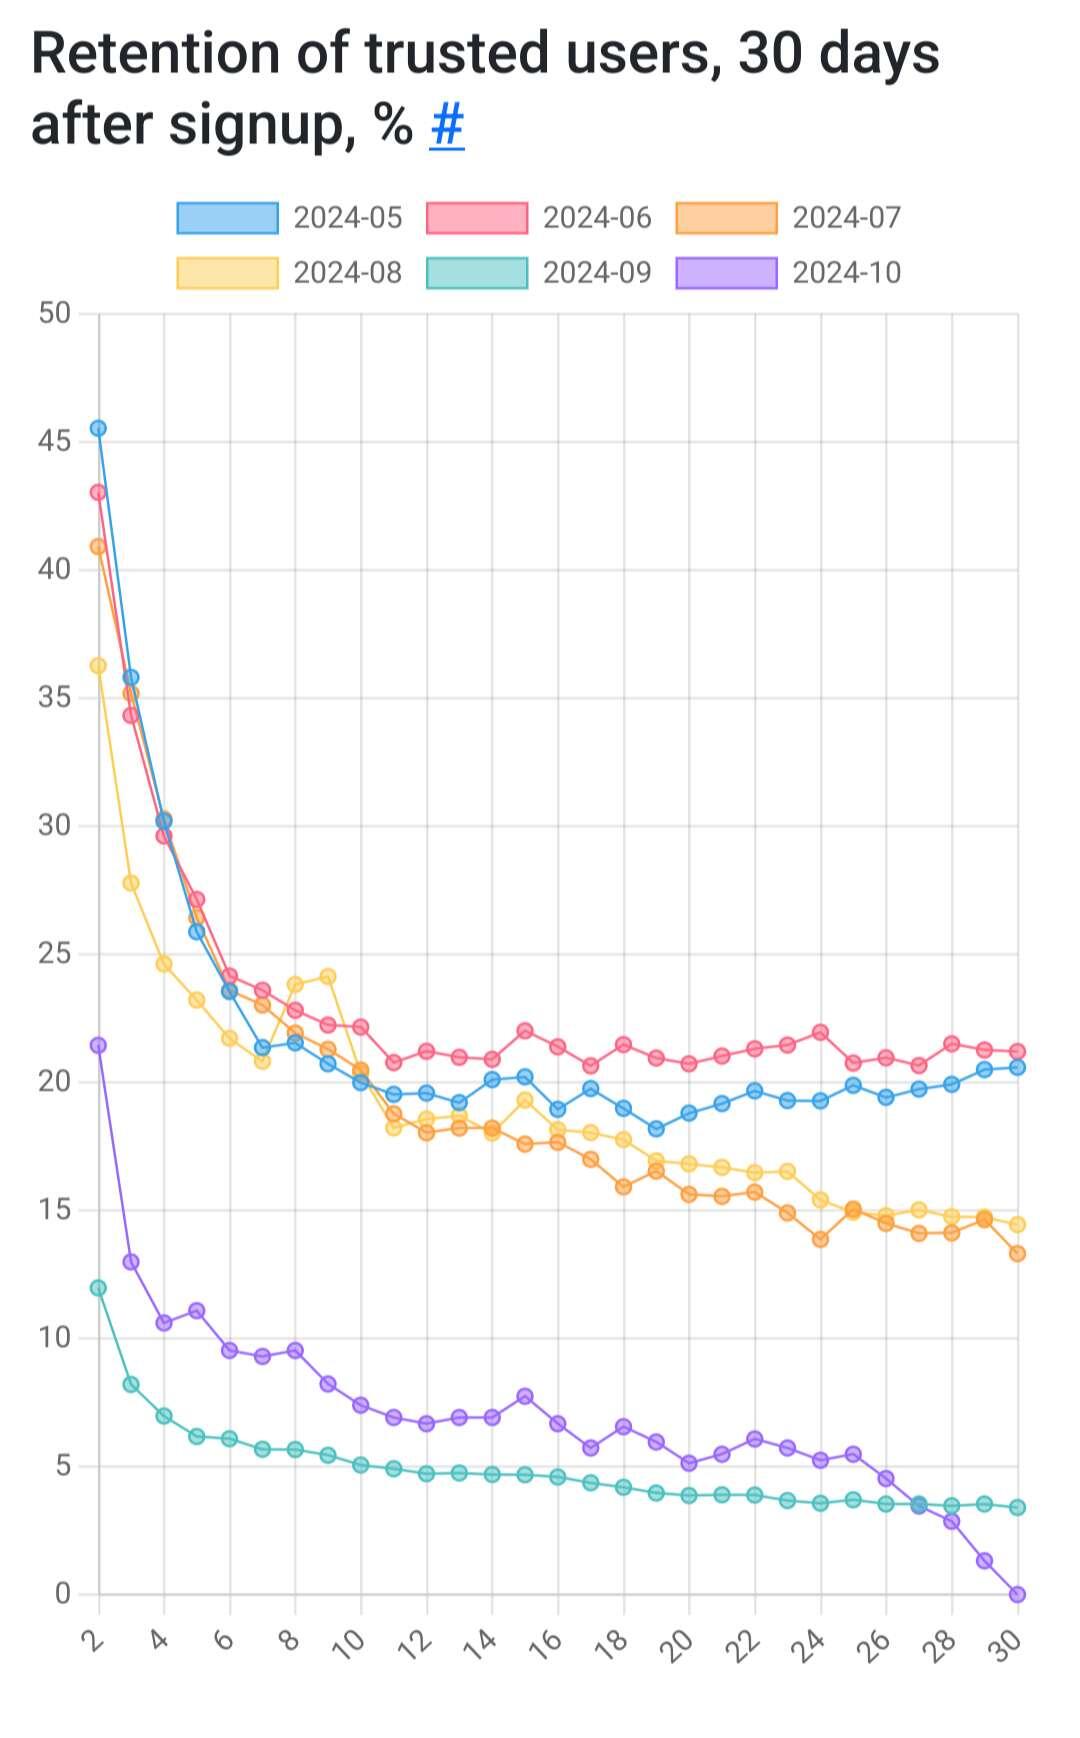
Going off that metric, of ALL the people who signed up in October, there are none left🤔.
Don't know if it's accurate, but that would be the cohort who got hit by ReplyGuy, right after joining.

I have ~ no trust in the stats
There's no way these changes in variability are a real effect
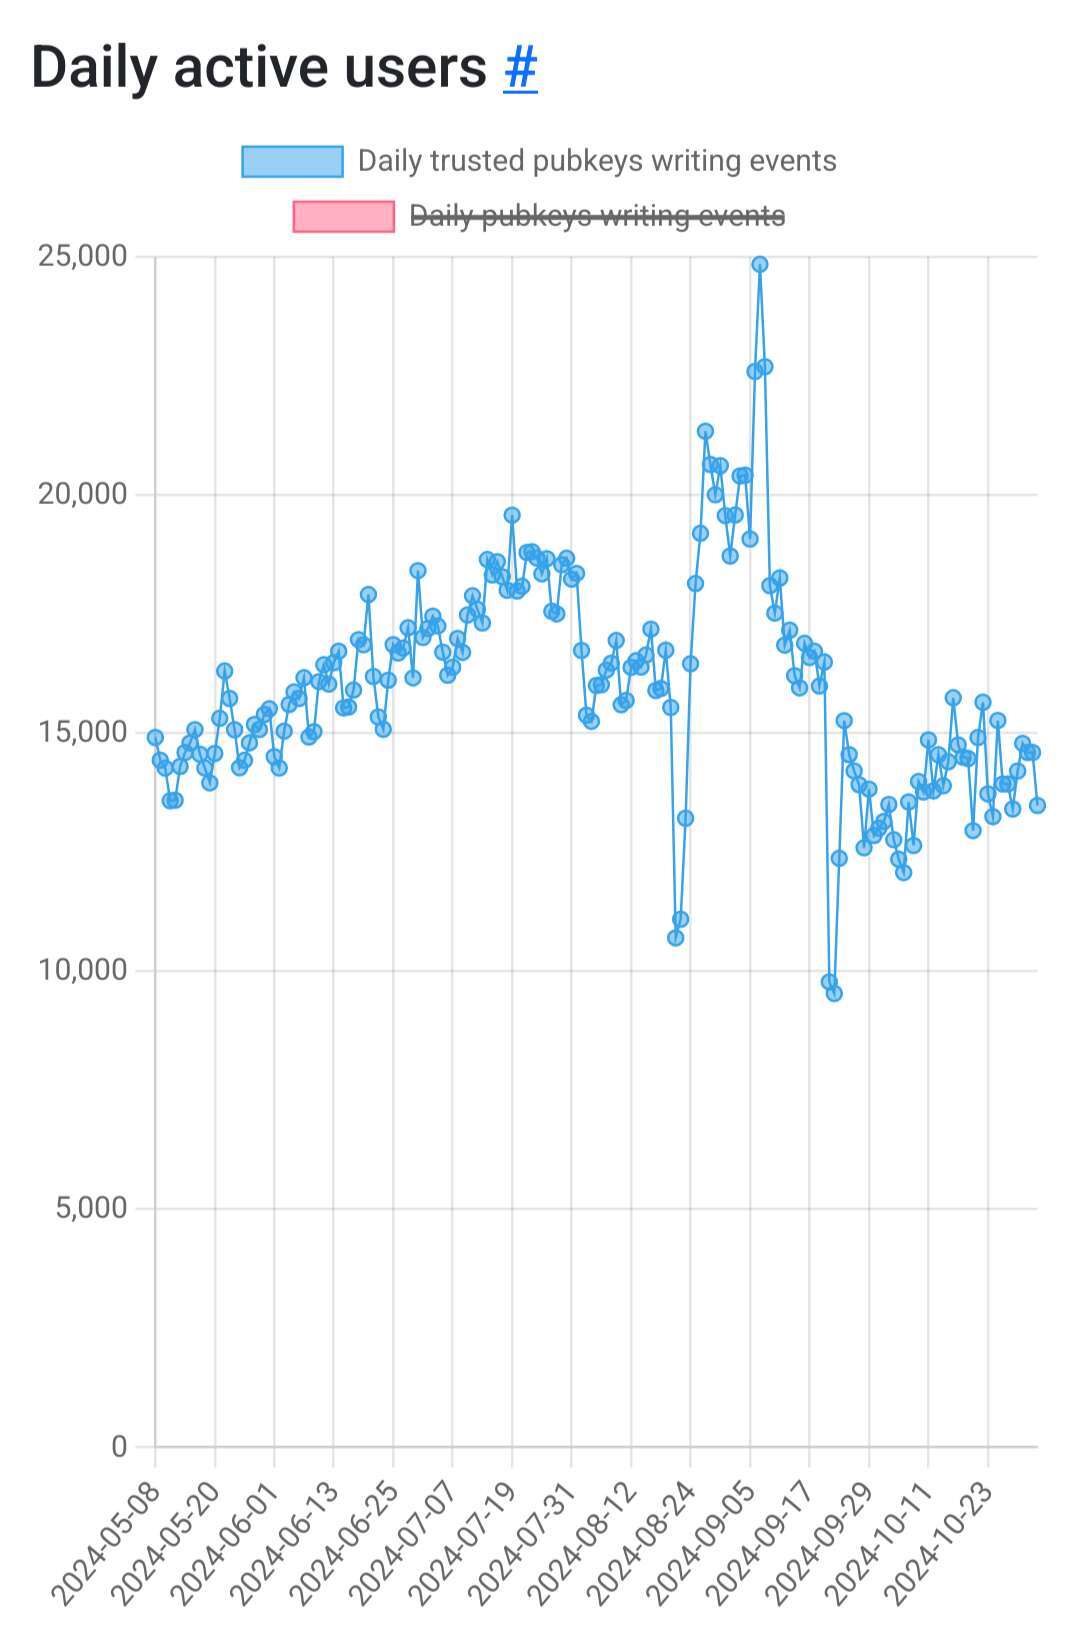
That chart is only in 5k increments. It checks out.
I mean the day-to-day variability
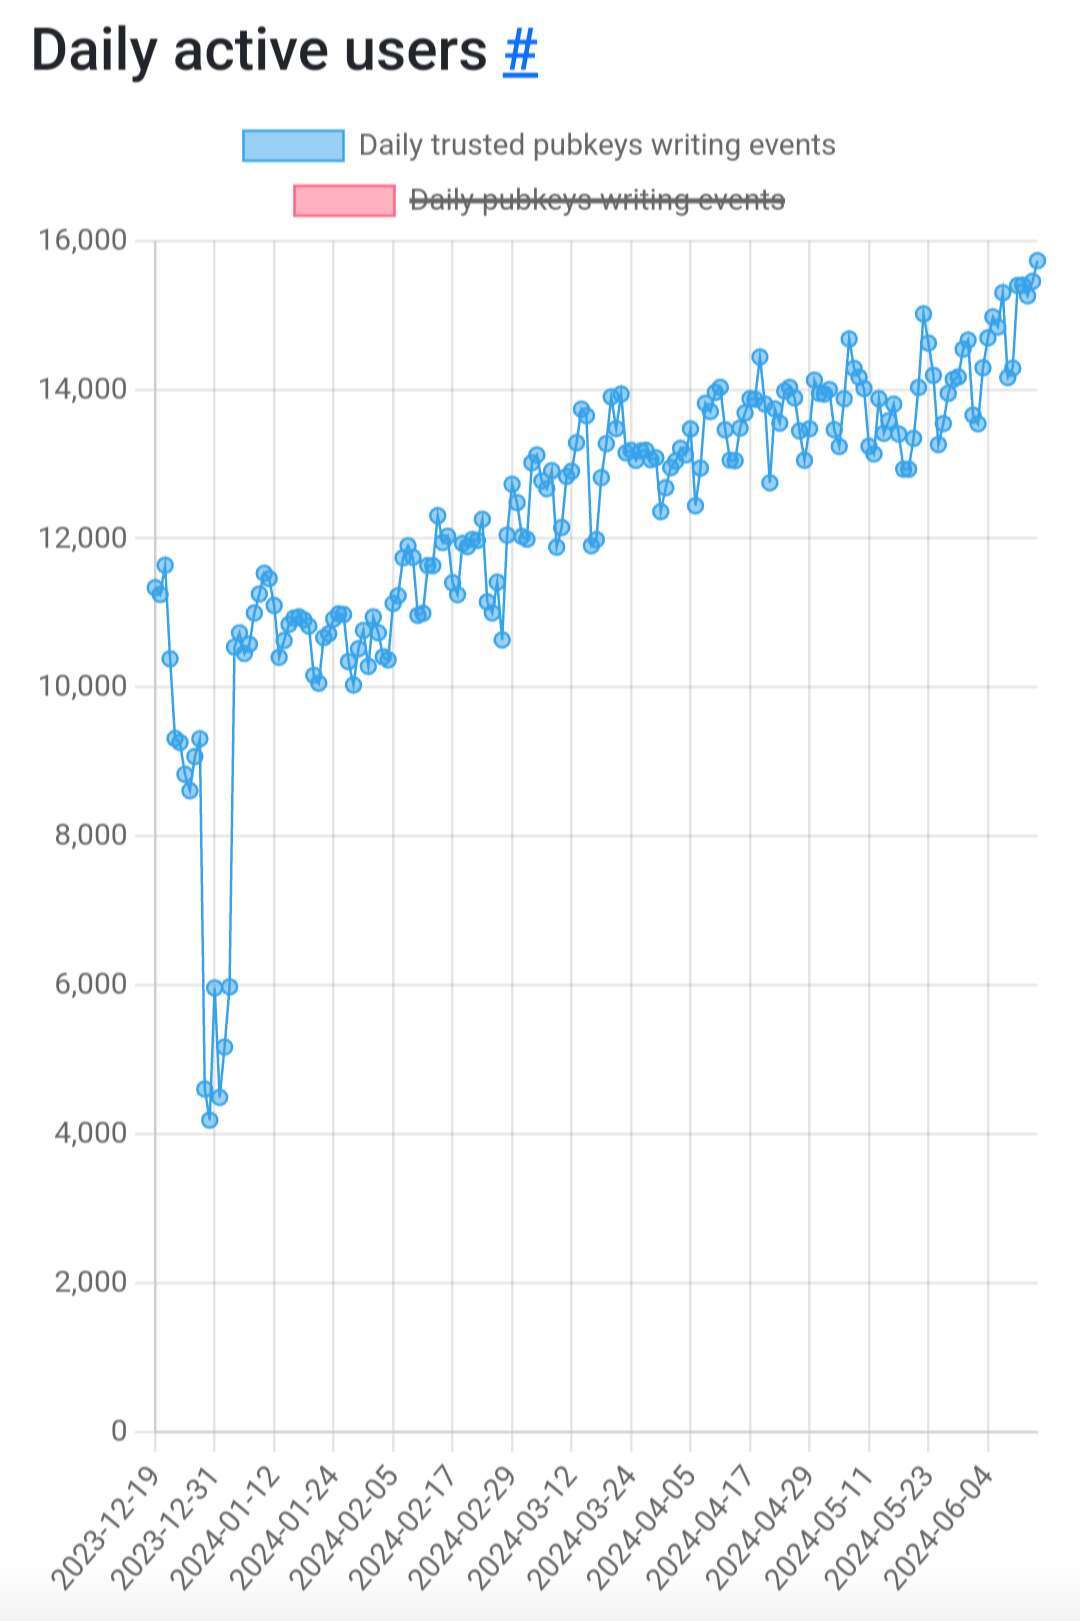
Prior to end of August you've got an eyeball variance of +/- 500 per day at the 95% confidence interval, superimposed on a linear trend
That started in January and lasted for 8 months
Then there's a step change to +/- 7,000 per day superimposed on I don't even know wtf to call that, which lasted about 2 months
Now it looks like we're back to +/- 500
I can't think of a reasonable model of human behaviour that would produce 10-fold step changes in variance

It is to a point that I thought that there is something wrong with my accout, relays, etc.