
What am I looking at for x and y axes?
Discussion

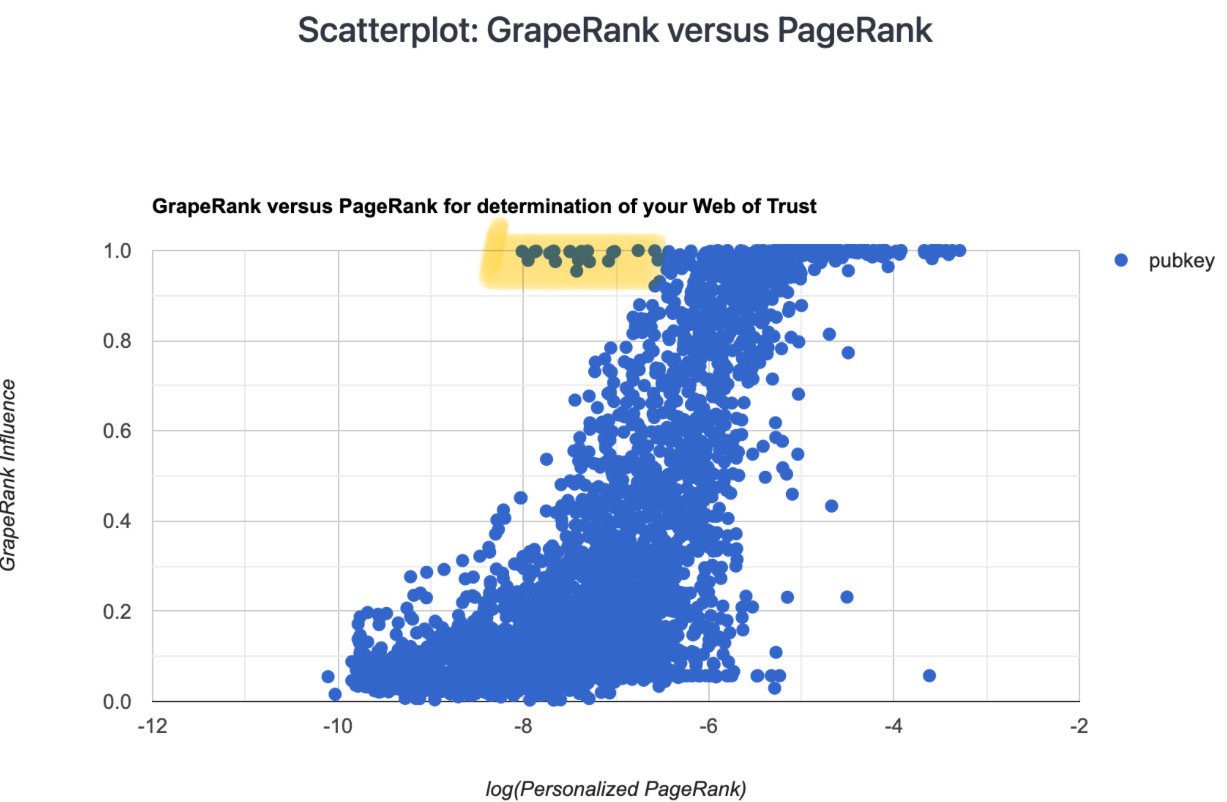
X axis is the log of the personalized PageRank score of each pubkey, with more trusted on the right, less trusted on the left.
Y axis is the GrapeRank score (specifically, the influence) of each pubkey, with more trusted = higher score.
It appears to me that there is a particular group of bots that can be picked up using this graph that would not be readily identified by using either PageRank or GrapeRank alone.
What is the bottom right one?
There are 30 pubkeys above -4 on X axis and below 0.2 on Y axis (the graph shows only a few thousand of the 180k pubkeys in my follows WoT) — Most of them are throwaway accounts I created myself for testing purposes and I’m the only follow. A few are real accounts that I follow but they have only 1 or 2 other follows.