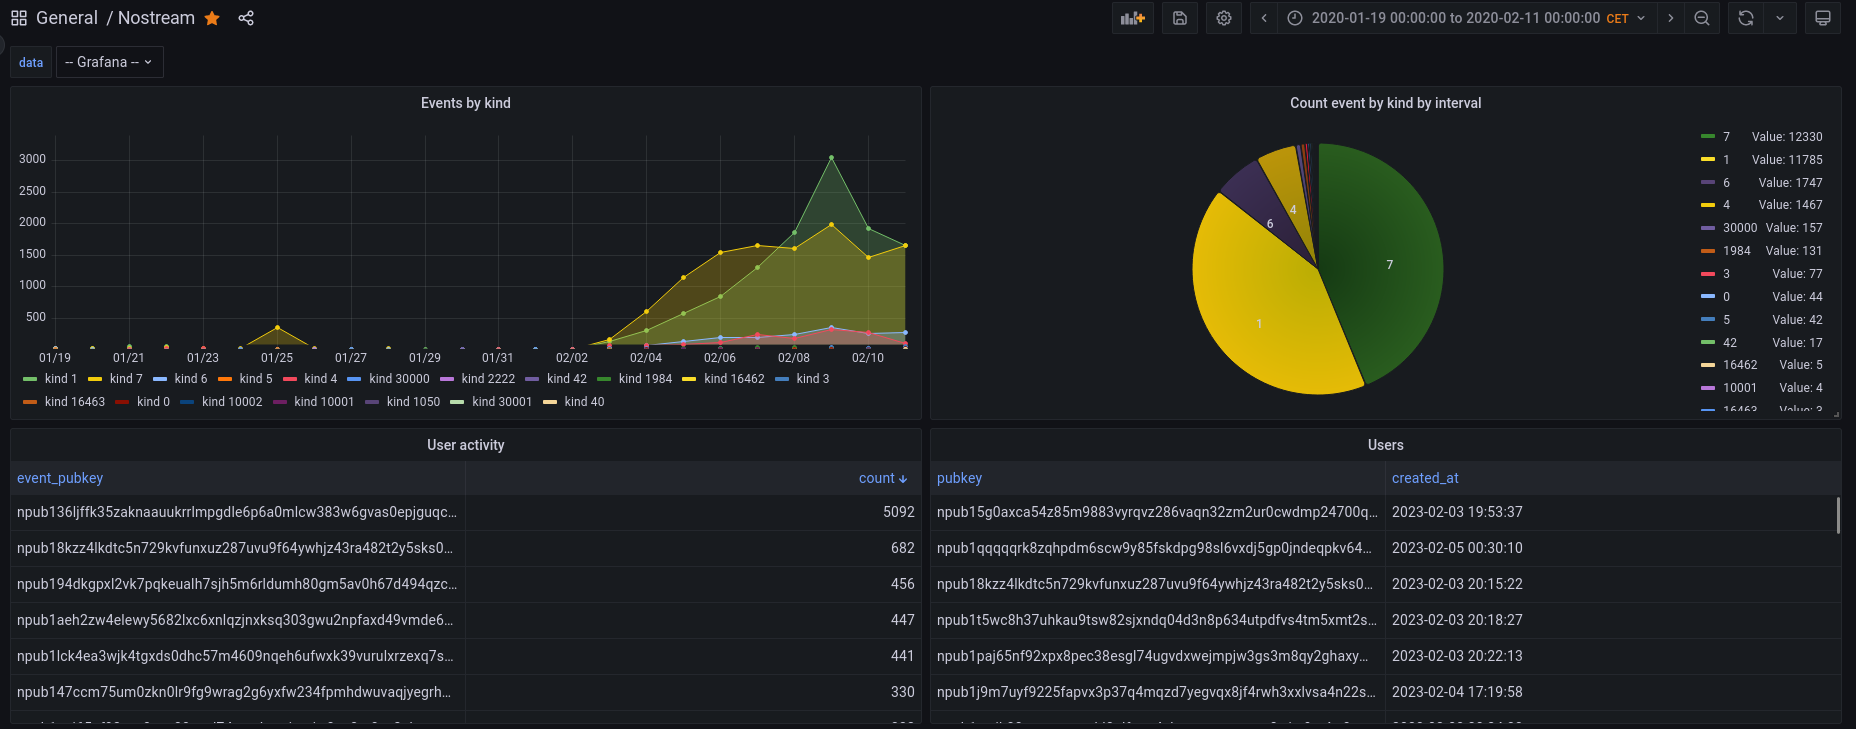
testing #docker #grafana - later nostr #relay #stats !
#plebchain #[0] was helpful - merci 🤙🏼💜
testing #docker #grafana - later nostr #relay #stats !
#plebchain #[0] was helpful - merci 🤙🏼💜
Hell Yeah!
What are you using for those custom metrics? StatsD, Prometheus, OpenMetrics or something else?
not sure what am doing - so far click click🖱🖱😂
doing each component manual is painful - try to docker image(s) or build within docker - or too many errors
Did you like decouple the parts of a relay into containers? Or are you trying to run a relay service in a single container?
Is this dashboard available somewhere or are you building it? based on which metrics?
Which relay are you using?
Sorry for too many questions, but this is what I do irl <3 and was planning to start such quest for Nostr relays.
python nostr relay
still digging ! learning continues - ext4 disk issues