Bitcoin S2F Validation — The S2FGM2 Model

Quantifying Bitcoin’s Liquidity Premium & Validating S2F as Fundamental Value

---

TL;DR

Bitcoin is prestine collateral that absorbs global fiat liquidity.

The S2F model explains Bitcoin’s long-term value, but short-term market noise often buries its signal. By introducing a liquidity premium using smoothed, lagged global M2 delta (GM2), we clean up that noise and reveal the truth:

> Stock-to-Flow is the fundamental driver of Bitcoin’s valuation.

With this model, we can project BTC’s price across time with statistical confidence (R² ≈ 0.965). The risk/reward becomes violently asymmetrical:

→ Massive upside

→ Near-zero long-term downside

There is simply no better place to allocate your time, energy, or capital than into the Bitcoin ecosystem.

-------‐-----------------------------------------------------------------------------------------------

1. Introduction: The Broken Compass

The Stock-to-Flow model introduced by PlanB in 2019 changed how the world saw Bitcoin. It made one thing clear: scarcity drives value. But like all simple truths, the signal got lost in the volatility of liquidity cycles, macro shocks, and human panic.

Critics said S2F failed.

They were wrong.

It wasn’t wrong — it was incomplete.

S2F gives you the shape of Bitcoin’s valuation curve. But price moves along that curve based on the available liquidity in the system. Without accounting for this, S2F’s predictive power breaks down during expansion and contraction phases.

Enter: Global M2 Delta — the missing variable.

---

2. Methodology: Smoothing Out the Noise

To construct a predictive model, we merged S2F with global M2 liquidity trends. Here's how:

a. S2F Input

Stock: Total BTC supply over time

Flow: 52-week rolling average of newly mined BTC

S2F Ratio: Smoothed for realism by using this style for flow, then lagged 13 weeks (markets digest scarcity slowly)

b. Liquidity Premium (GM2)

We calculate the weekly change in global M2

Apply logarithmic weighting to normalize the impact of extreme events

Smooth with a 26-week rolling average

Lag 13 weeks to reflect transmission delay between liquidity and asset valuation

c. Price Input

Weekly HLOC average (high, low, open, close) used for modeling correlation to S2F + GM2 conditions

Final output is implied market cap, which we divide by BTC supply to project price

---

3. The Equation

Final model structure:

BTC_Price = 10 ^ ( 7.11513 + 2.72284 * LOG10(S2F rolling 52 week) + 0.03603 * Smoothed_Lagged_GM2) / Stock

Translated:

S2F defines the price gravity.

GM2 adds or subtracts energy (liquidity premium).

Price drifts around the gravity curve, but the model shows exactly where it should be.

---

4. Model Results

R² ≈ 0.965

Works across all Bitcoin cycles. When delta off of predicted price is charted the real dollars off of predicted has stayed fairly stable at extremes. As BTC's value has risen the % the real price deviates from predicted has shrunk dramatically. This shows that the market are maturing and the model is becoming more accurate with time.

The modle captures both the exponential long-term growth and the chaotic interhalvening price runs.

Behavior at +2SD are due to massive surges in s2f coupled with GM2 liquidity. (think Q4 2017, Q4 2020)

Behavior at -2SD is rare and violently reverts upward (like a beach ball being released underwater)

---

5. Fibonacci Lags & Market Psychology

The weirdest thing? The model optimizes at Fibonacci-style lags and smoothing windows:

8, 13, 26, 52 weeks

Multiples of 13 (the trader’s Fibonacci)

These lags give the highest R². They were not picked at random or on a hunch.

We believe this may reflect:

-Investor psychology cycles

-Miner selling rhythms

-Liquidity digestion times baked into market behavior

-Natural financial oscillations that humans unconsciously follow? To me it does not fell random.

---

6. Conclusion

Bitcoin is a pristine collateral that absorbs FIAT liquidity. This model — the S2FGM2 Equation — validates Stock-to-Flow as the primary fundamental force behind BTC’s valuation, and introduces the GM2 liquidity premium as a way to make sense of market noise.

What remains is clarity.

With this tool, we can now project Bitcoin’s price with confidence, cycle over cycle. The risk/reward profile is unmatched. Your long-term downside? Practically zero. Your upside? Infinite (as S2F approaces infinity) and asymmetric.

***There is no better place to invest your time, capital, or attention than in the Bitcoin ecosystem.***

---

"Markets are messy. Bitcoin isn't. Liquidity comes and goes. Scarcity stays."

~jason the original & Gabbie, 2025

I'm afraid if I start using this to trade I might break nostr:npub1lnm0ac8ft8r3jhddchekledgwvqrkwy7wqejjwcxq47gy87te8zs6utnnn

I'll be gentle with you guys.

Reply to this note

Please Login to reply.

Discussion

I honestly didn't do it for trading. I did it because PlanB's STFX model interested me but is like ok you can't do a regression on his stuff and get a statistically significant model for BTC using daily pricing. He did stuff where it was like grouping things together for certain time periods gave you statistical significance but it was fuzzy math.

I watched some thing where people were sliding gm2 money supply around and matching peaks and troths with Bitcoin. Really rudimentary stuff. But I was like huh, it does look like btc lags gm2 but it was obvi not directly corelate.

I started thinking about how scarce assets go up in value first when there is inflation; inflation is a result of M2 creation. I wonder if I can sharpen up S2F and prove to myself it is the legit driver of BTC value.

Then when I got a bump on my first try I started tinkering around with lag because M2 doesnt create inflation overnight. Then finding the best lag. Then plotting r2 value over different lag times. Once I optimized GM2 lag I was like we'll what about lag on S2F. That tightening shouldn't be felt overnight either.

As you can see once I start digging into something I can't stop. Messed with weighting and smoothing and lag and optimized each. I think I could get it even tighter if I used daily pricing instead of weekly. But .97 is very high and it probably would still round to .97 no matter what.

Had to share because I thought it was cool and I thought it was weird that optimized smoothing and lag all were fibs.

R² > 0.95 is huge.

Congrats!

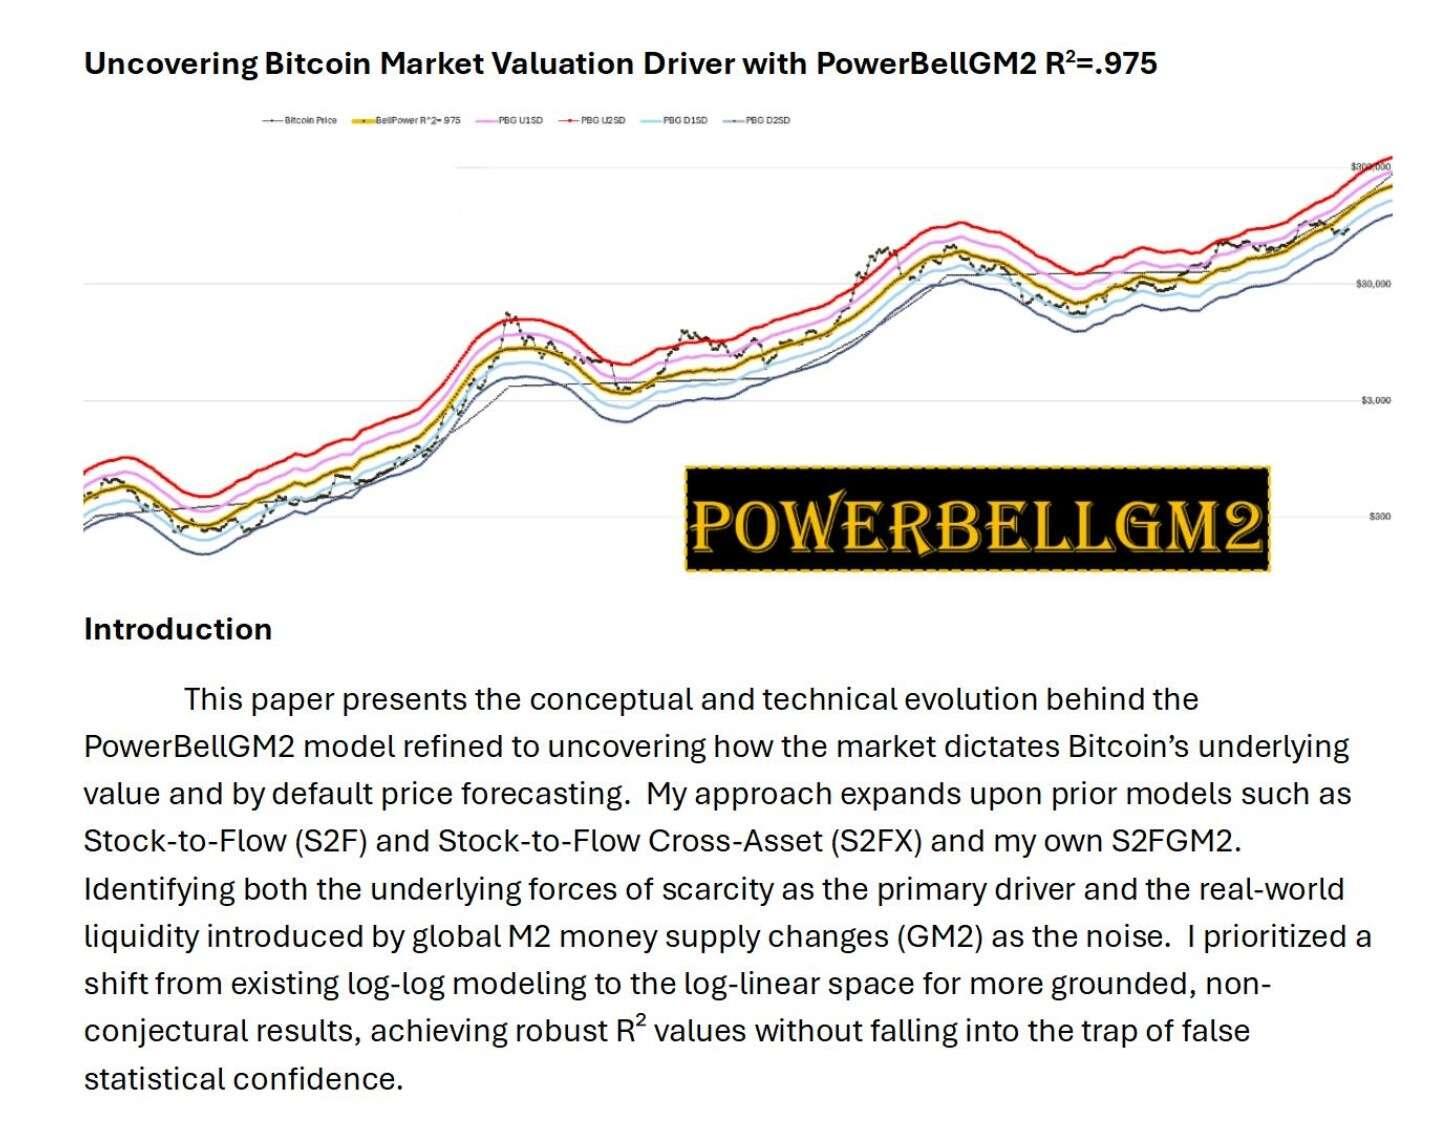
Still holding in? I actually revisited this because I didn't like that the power trend line for all weekly BTC price breaks below the S2F model long term. Basically I started say well how bad will it break do I have to keep readjusting? That's a big fault. Read more about people saying that because I didn't use strictly price and I used market cap and divided out stock to get price I was getting r2 higher than I should. Bunch of shit.

I came up with something even better that fixes those problems arguments and gets a r2= 975.

Using weekly price. Most granular chart ever also its log standard time unlike planb log log. Uses what i learned from s2fgm2. I actually wrote a white paper that 3xplaines everything.

I think it is fucking genius. But I'm partial. Look at this shit! It doesn't break.

https://1drv.ms/w/c/4c4514cda59498b0/Eb_4HMYDJnlIvNYL3fVSmXsB4pr8nldaiYlSHFy1G8yD4w?e=EPBqsR

If you want to check out the whitepaper here is a link. Not sure how else to share so people don't think I'm trying to spread awareness virus or some shit. If you know anything way I'll do that.

If your a statistics nerd like me.

When I find the time I'll test it myself independently. Don't trust, verify!

But your work looks solid.

👏

Don't trust,; verify.

If you run into any issues let me know and I'll walk you through it. There were a lot of things I tweaked to get better r2. Like instead of big delta bumps once a month in GM2 I took the delta and divided it into the weeks of the month. Stuff like that.

So I opened a long yesterday on nostr:npub1lnm0ac8ft8r3jhddchekledgwvqrkwy7wqejjwcxq47gy87te8zs6utnnn based on my (simplified) interpretation of this. Going well.

We'll see how it does over the next 15 days.

I expect to make a few million sats at least. I will zap generously if I do!

I even made it on the leaderboard... although at a humble 10th place.

https://lnmarkets.com/en/leaderboard

Still, can't complain...

If you use it for trading let me know own how it goes and remember each point is a week. Things move slow.

Will do!