
What happened in 1995? A pivot in Fed inflation percentage target, perhaps?
Discussion

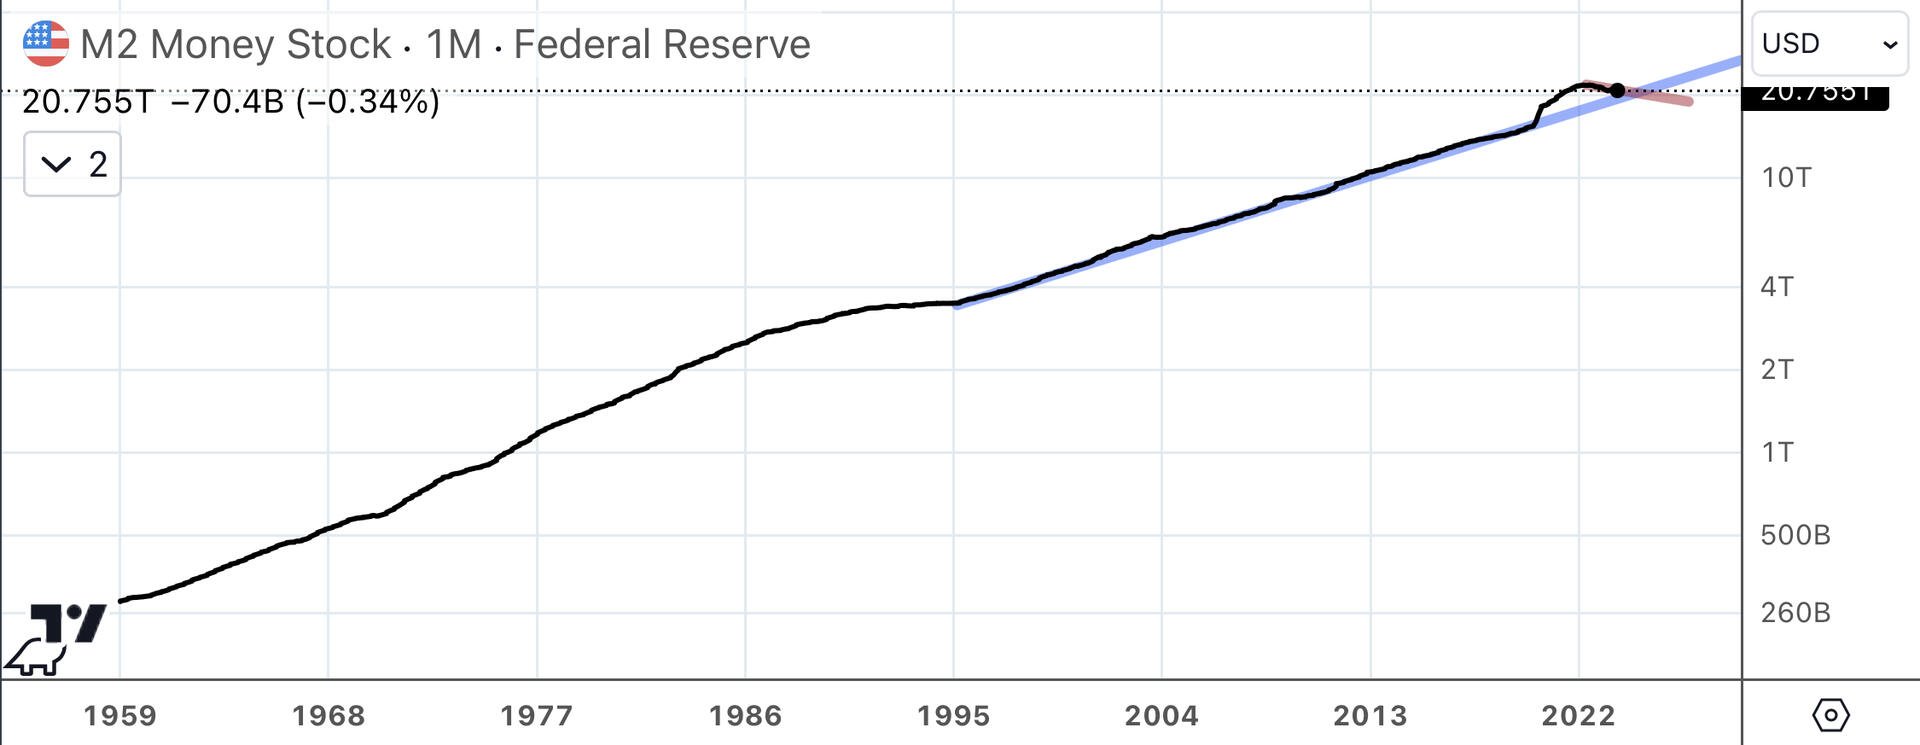
Zooming out, here’s all of FRED’s M2 data, log scale. The shape of the line from 1959-1995 shows an elongated S-curve.
This means that money supply growth from 1959 until the mid-1980’s was super-exponential. That is, it was growing exponentially, exponentially.
It was this super-exponential growth that led to the dollar/gold depegging, Nixon’s closing of the gold window, the crippling inflation of the 1970’s, and Volker’s interest rate hikes in the 1980’s.
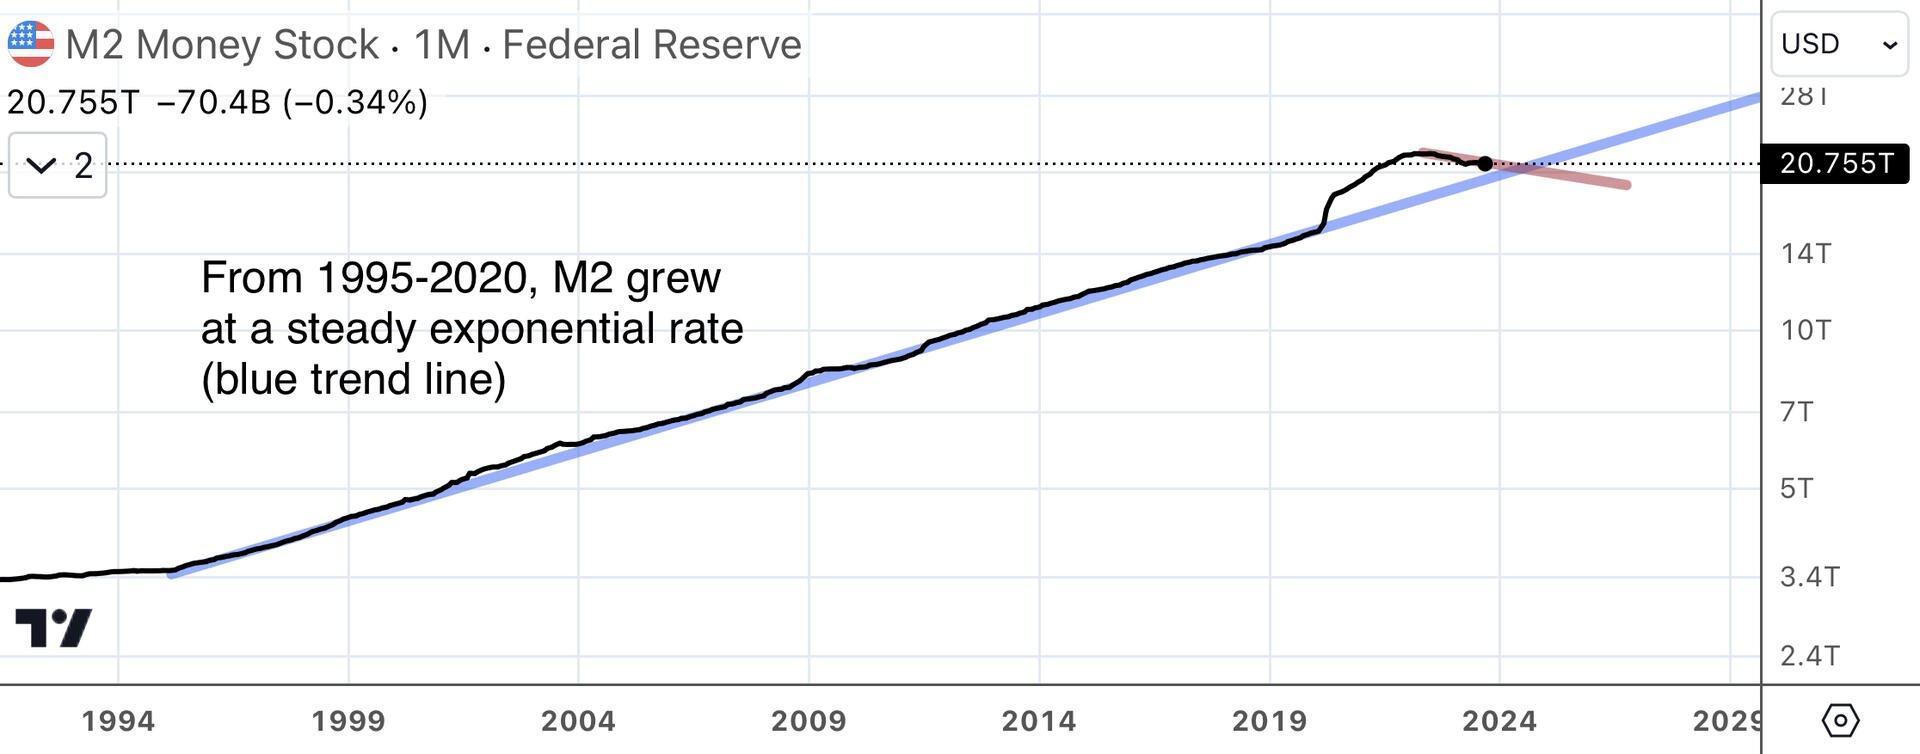
The top portion of the S-curve from 1980’s through 1995 shows the success of Volker’s high interest rate regime at curving M2 back down to the trend line. I don’t know what happened in 1995 under Greenspan to initiate the stable period through 2020.