Prediction: Fed will loosen in summer 2024.

Explanation in three parts.

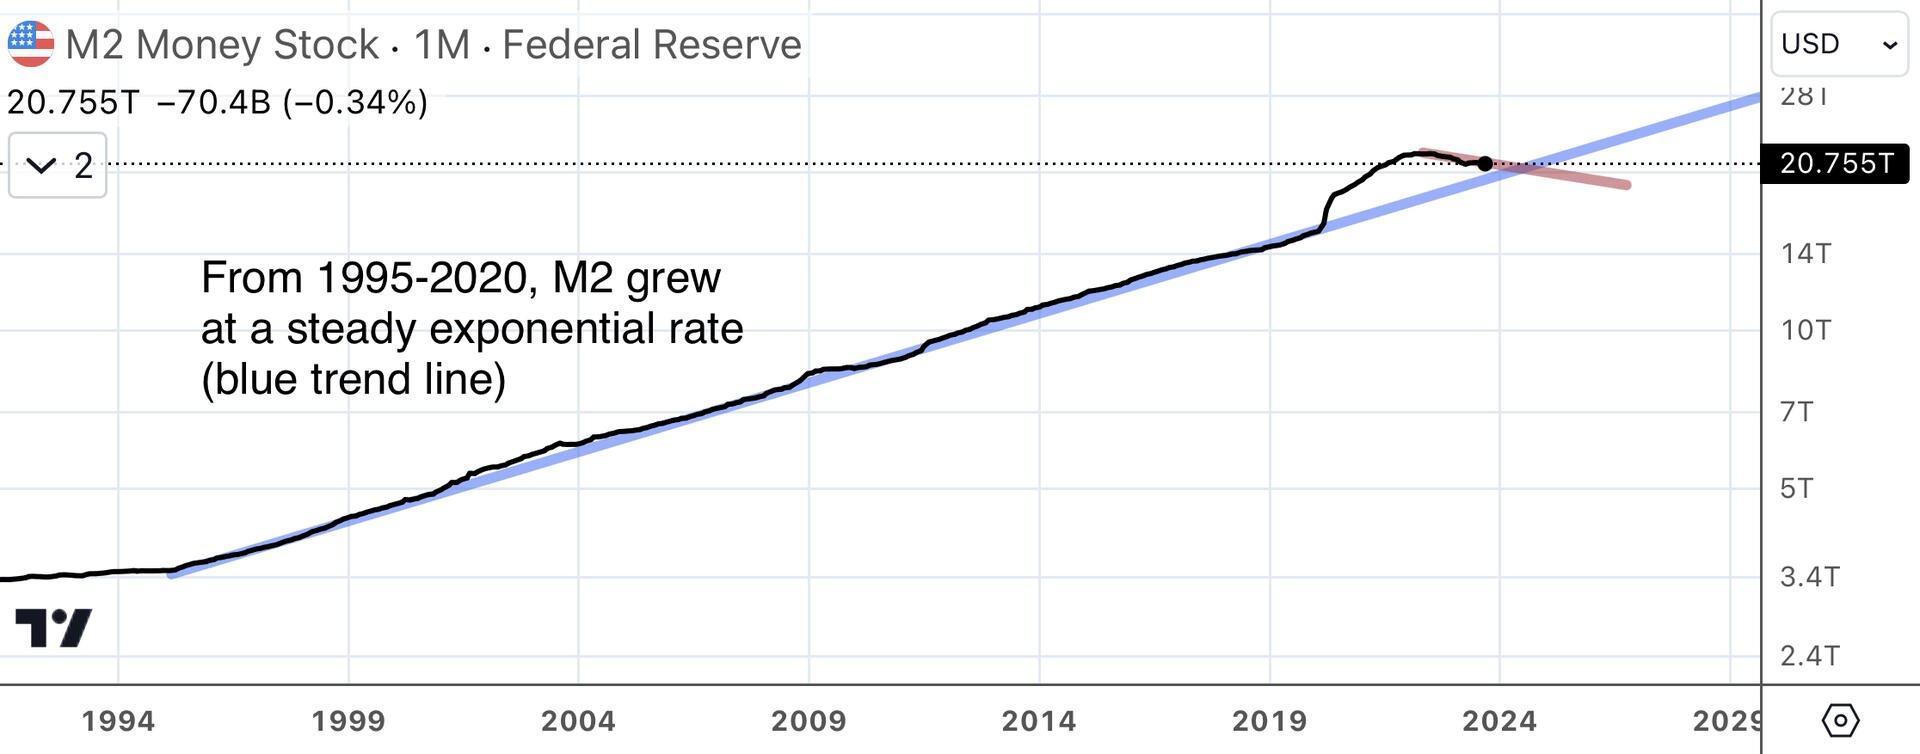
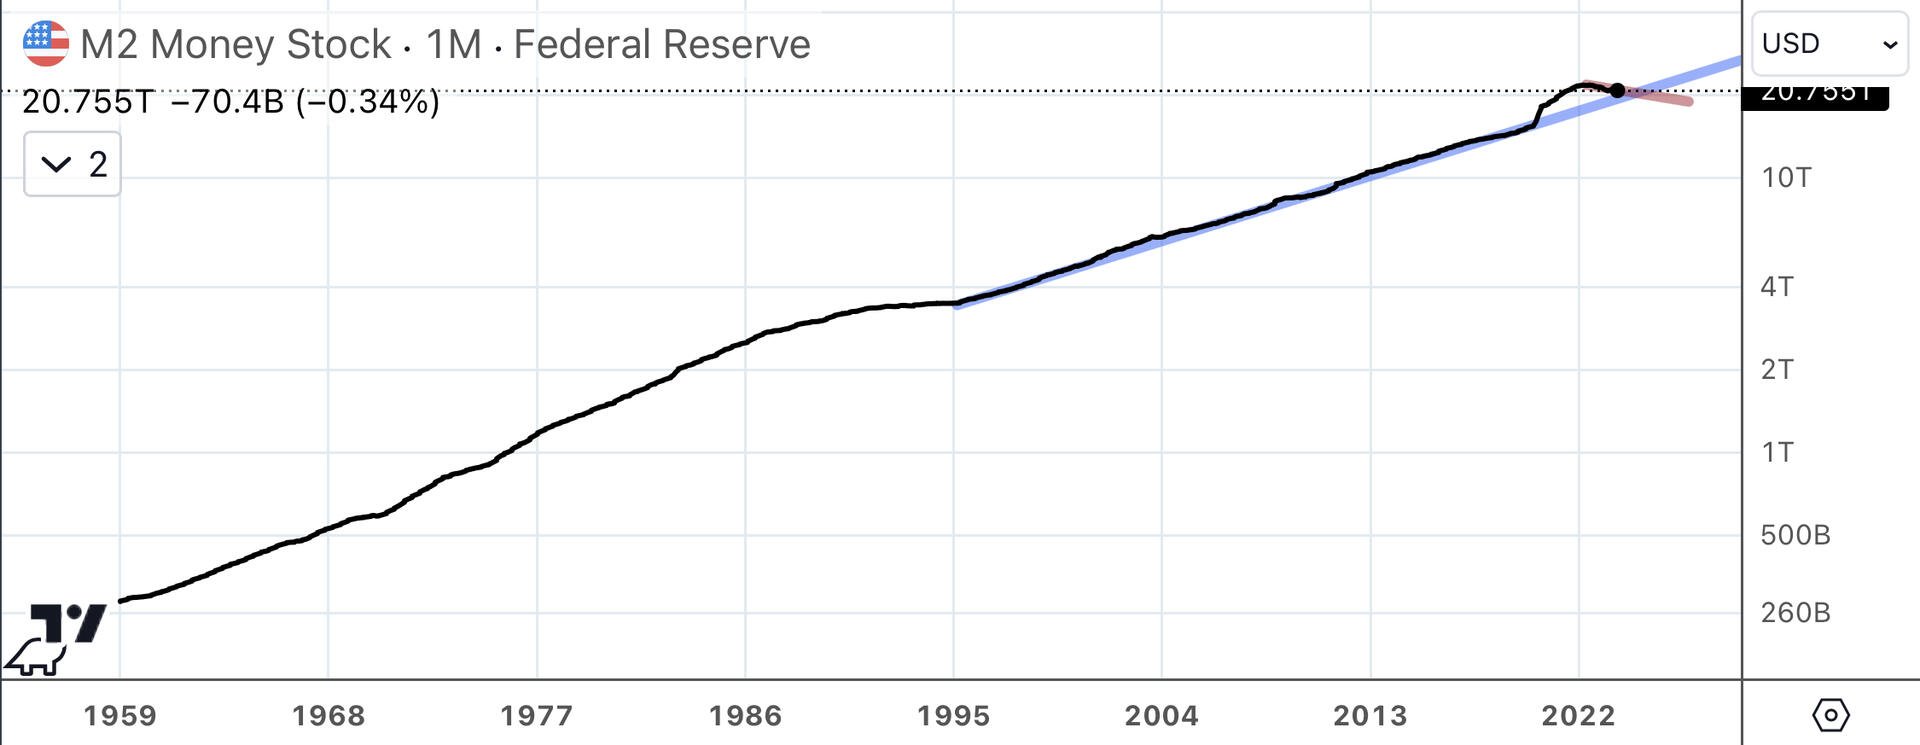
1) From 1995-2020, M2 grew at a steady exponential rate, shown as a straight blue line on the first chart. The dot com bubble/bust, September 11, the global financial crisis of 2008–none of these caused a meaningful deviation from trend.

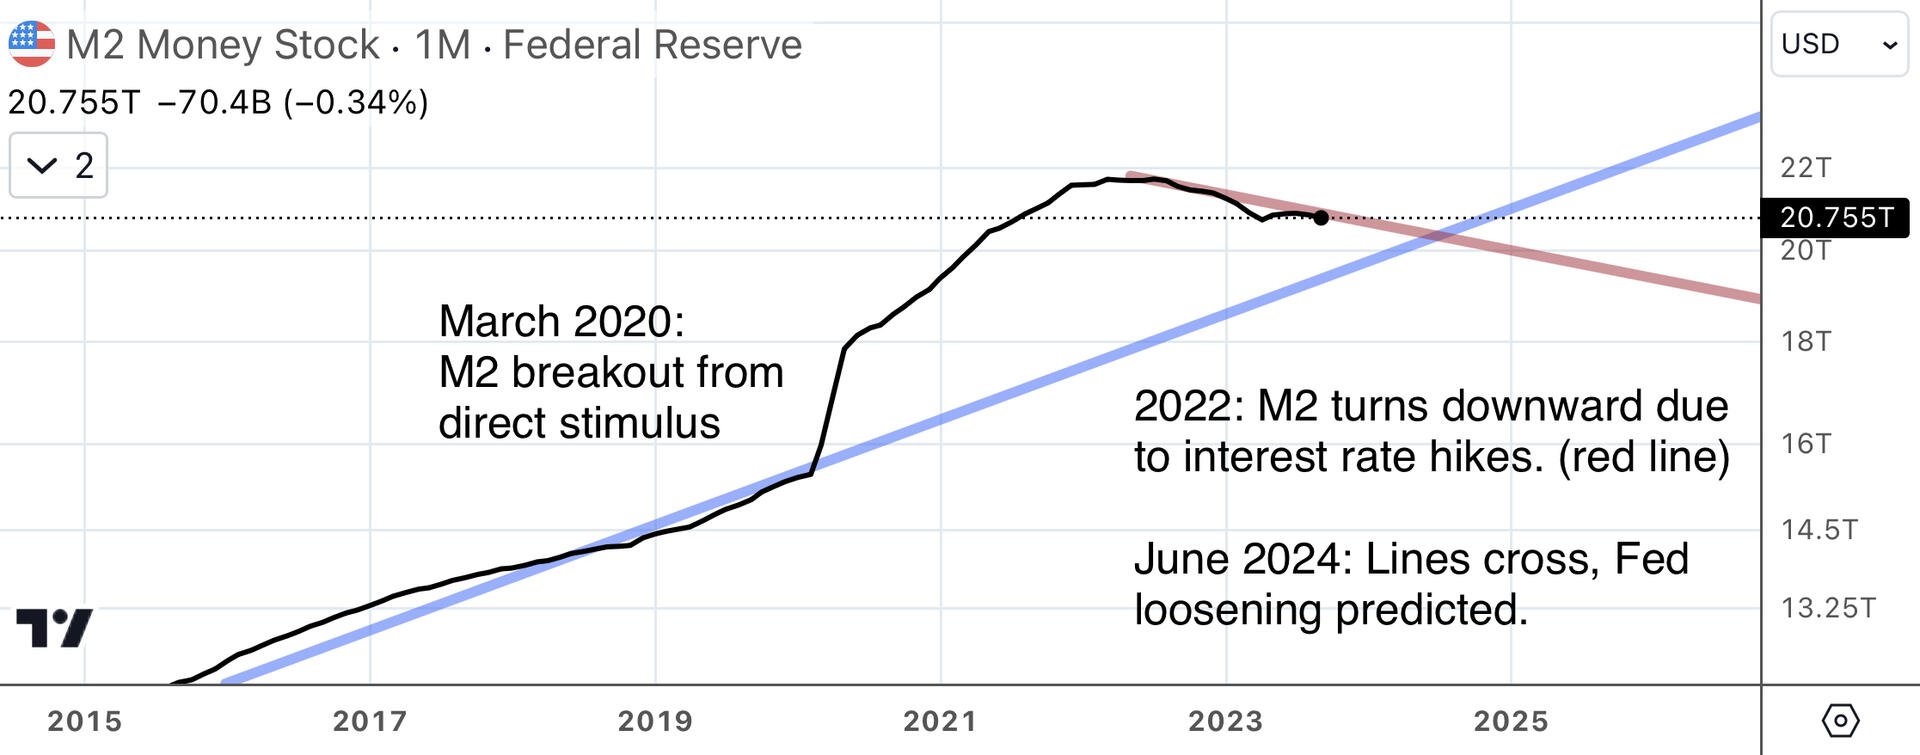
2) March 2020 broke the trend. M2 shot up due to direct stimulus checks. This caused price inflation.

3) The Fed’s 2022 tightening caused M2 to trend downward, shown as a red line on the second chart. The red line intersects the blue in June/July 2024.

Conclusion: In summer 2024, the Fed will have succeeded in bribing M2 money supply growth back to the 25 year trend and will resume their loose, expansionary monetary policy.

Reply to this note

Please Login to reply.

Discussion

What happened in 1995? A pivot in Fed inflation percentage target, perhaps?

Zooming out, here’s all of FRED’s M2 data, log scale. The shape of the line from 1959-1995 shows an elongated S-curve.

This means that money supply growth from 1959 until the mid-1980’s was super-exponential. That is, it was growing exponentially, exponentially.

It was this super-exponential growth that led to the dollar/gold depegging, Nixon’s closing of the gold window, the crippling inflation of the 1970’s, and Volker’s interest rate hikes in the 1980’s.

The top portion of the S-curve from 1980’s through 1995 shows the success of Volker’s high interest rate regime at curving M2 back down to the trend line. I don’t know what happened in 1995 under Greenspan to initiate the stable period through 2020.