
Looks like a small percentage of the population is benefiting from increased productivity, and it's not working people. 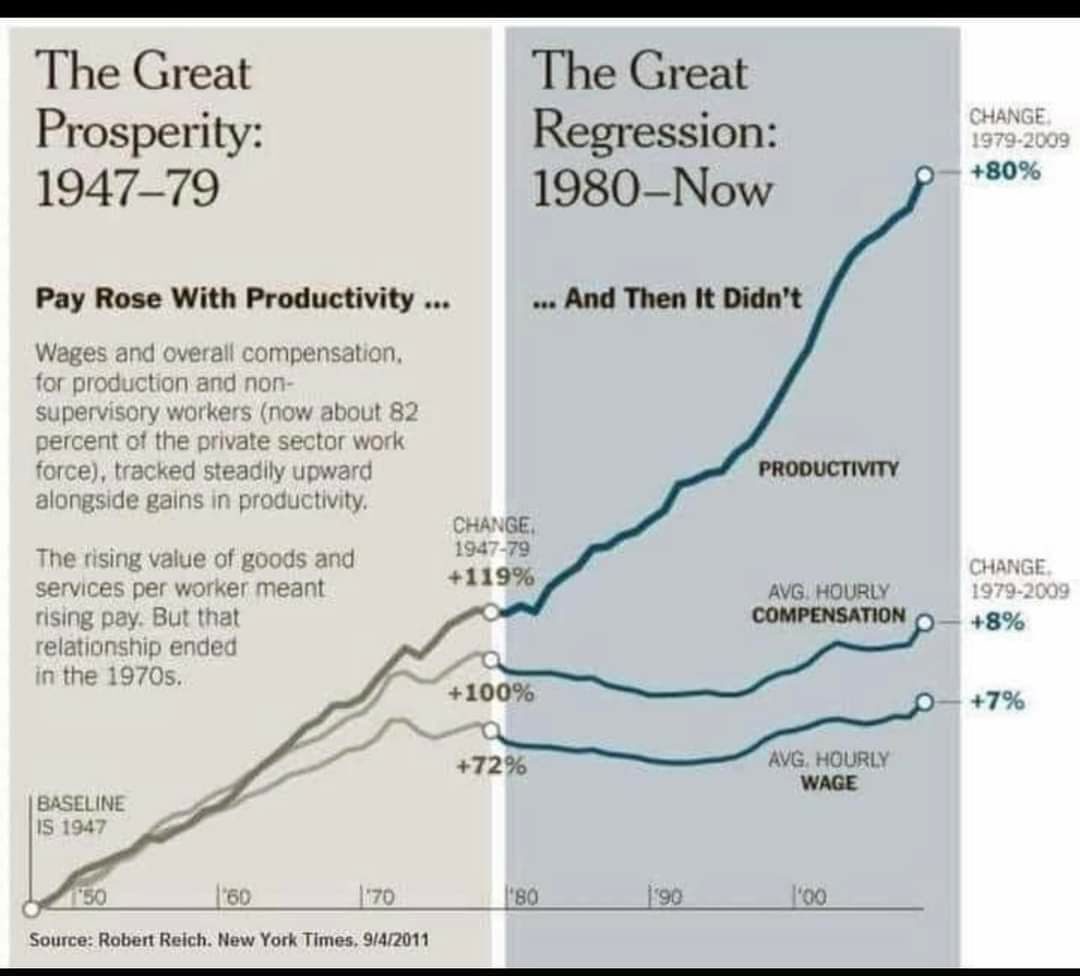
Discussion
The inflection point (which you can see on the graph) is 1972 - when Nixon took USD off the gold standard.

Wtfhappenedin1971.com

brutal

My guess would be the productivity gains were from manufacturing improvements during the first period. And the productivity gains in the second period were from computers from 1980s onward. But do we really know how they are measuring productivity and do these numbers exist broken out by industry?
productivity increased with the help of computers.
wages stayed the same
more profits went into the pockets of the slave-wage overlords.
Theory 1: Monitoring productivity in a manufacturing situation is easier, while monitoring productivity within a software development situation is not. So a larger share of the productivity improvement goes to management. And this wage statistic deliberately excludes managers.
Theory 2: Among software developers often the value that kind of worker can bring to a company is order of magnitude larger than their salary. While the individual software developer isn’t completely irreplaceable so the salary they can negotiate does not rise with what they produce. So a disproportionate share of productivity in a software situation goes to the companies surplus ie owners of the company. (It’s still a decent career mind you)
Theory 1B: because it’s harder to measure productivity in a software environment more managers are hired so there is a greater density of manager to employee than there would be in a manufacturing situation. Thus more people are managers than they used to be and their wages are excluded from this metric. (This is the most hopeful theory, basically the population represented by the graph may be declining over time as more of the population takes on software based jobs, a larger share of the population thus “needs” to be managers for them and so the “averages” displayed are no longer as “typical” of the typical worker as more “typical” workers must be managers.
Theory 1c: Because of the way managers are strictly excluded from the graphs wage statistics, what we are looking at in the second part is how people early in their job experience compare to the aggregate productivity at that time, while in the first phase. It Is more representative of multiple levels of experience.
Theory 3: Clearly there has been an increase in automation. As automation increases the productivity benefits are caused by the capital investment of the machinery not the productivity benefit from a worker with greater skill. So the wages that can be negotiated by the workers are related to the their replaceability. If they can be easily replaced negotiated wages will be lower than if replaceability is hard for any reason. (I believe this is the main argument for using this kind of graph, it’s essentially a call to action for union protection from Robert Riech and laws which make unions stronger or easier to form.
the relationship between employee and employer needs to change, thats all. otherwise, let the slavery continue!