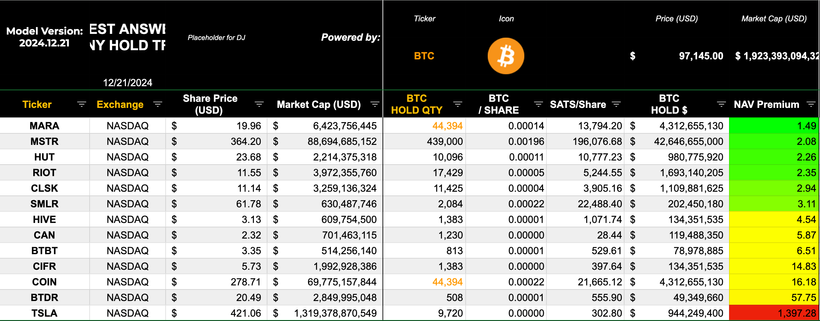
There isn’t much “signal” to read from that last column on the right, as every company in that cohort has a significant OPERATING business relative to its market capitalisation.
MSTR is the only pure play (op biz less than 2 percent of mkt cap, the rest is “bitcoin treasury”)
If you had a dozen OTHER (nearly) pure play “Bitcoin Treasury Businesses” then that chart would be valuable for comparison purposes.
Just sayin 😉
It seems like the companies doing a ₿Itcoin treasury strategy are really just zombie companies that were doomed and are trying this strategy for pure survival purposes.
Indeed. The miners are a perfect example of this. Pivoting recently to buy Bitcoin instead of ASICs.
I could see by next cycle the large public miners creating significantly less of the global hash than they do right now. Leaving them as just public shell Bitcoin TSY companies.
In truth, many more companies will likely do this as AI takes a wrecking ball to their operating models….
Just my 2 sats….😉
Also, at the 1:09 mark, they discuss the zombie companies, including the publicly traded miners, going into the BTC treasury paly.
Thread collapsed
Thread collapsed
Thread collapsed