
What does this mean? I’m new to these kind of charts
Discussion

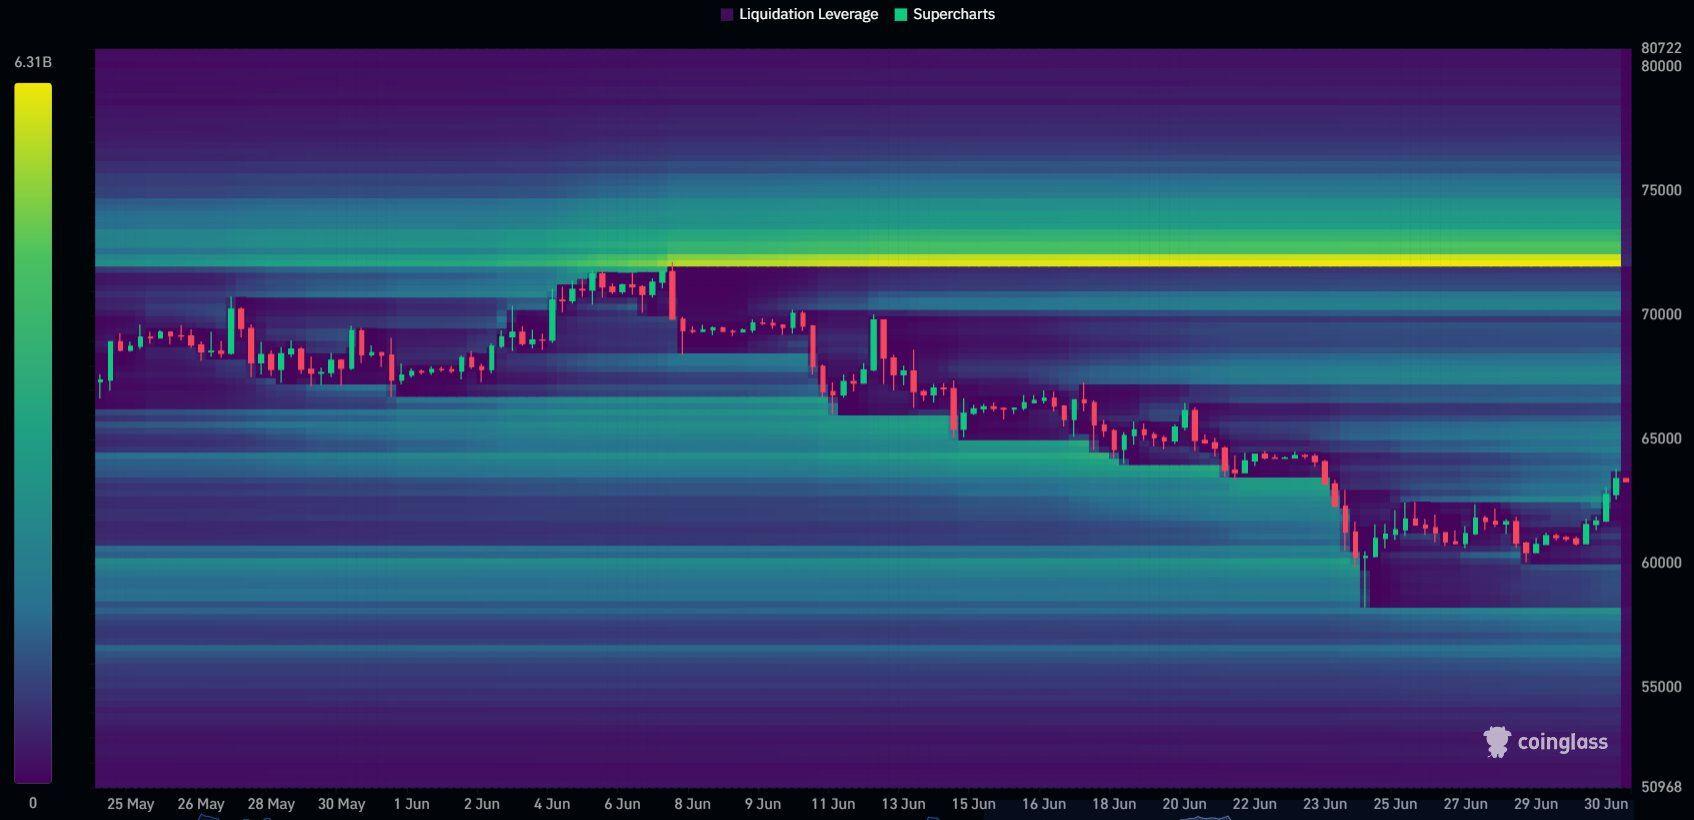
So the highlighted green area and yellow areas is where liquidity for longs and shorts sit ..
74 has about a billion to be liquidated and there about 500 million around 60 again..
Price tends to reach for liquidity