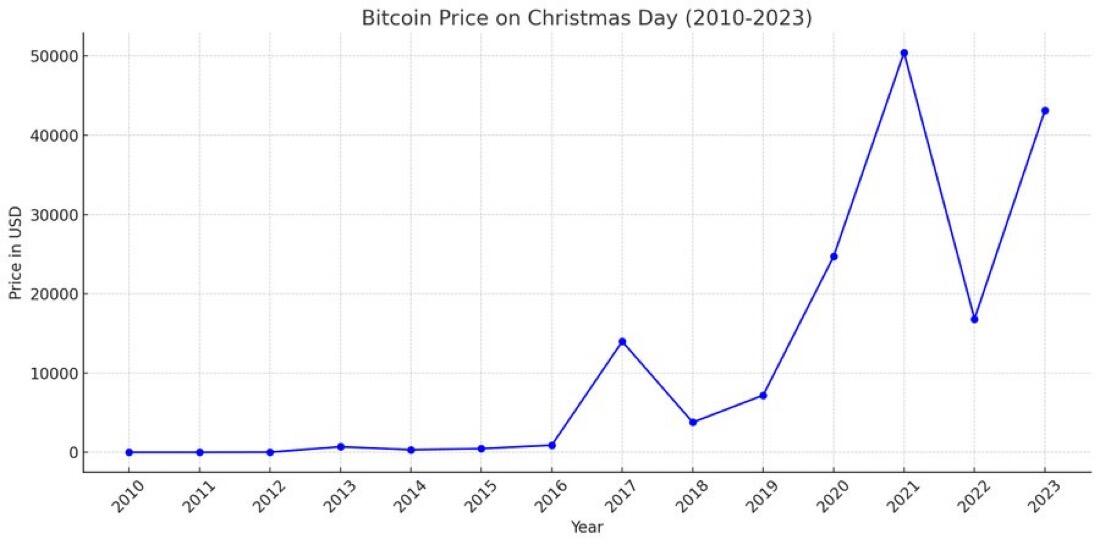

I think for those that weren't around, price discovery between 2010-2016 is lost on some people because we've zoomed out too much.
I think at this point if we want to communicate how halving (other factors) affected price discovery, we need two graphs. The second is as it is for the years 2016-2023.
The first however, has a pricing axis of only up to $1000.