On the flip side, the 2019 and 2022 #Bitcoin bear markets ended when the $BTC RSI broke the downward trend line.
The break marked the bottom of the bear market for #BTC 
Is $70k the top for #Bitcoin ? Not according to its RSI trend line.
In both the 2017 and 2021 bull run, when $BTC failed to get above its RSI trend line, that marked the top for #BTC . Bitcoin is no where close to even being there yet. 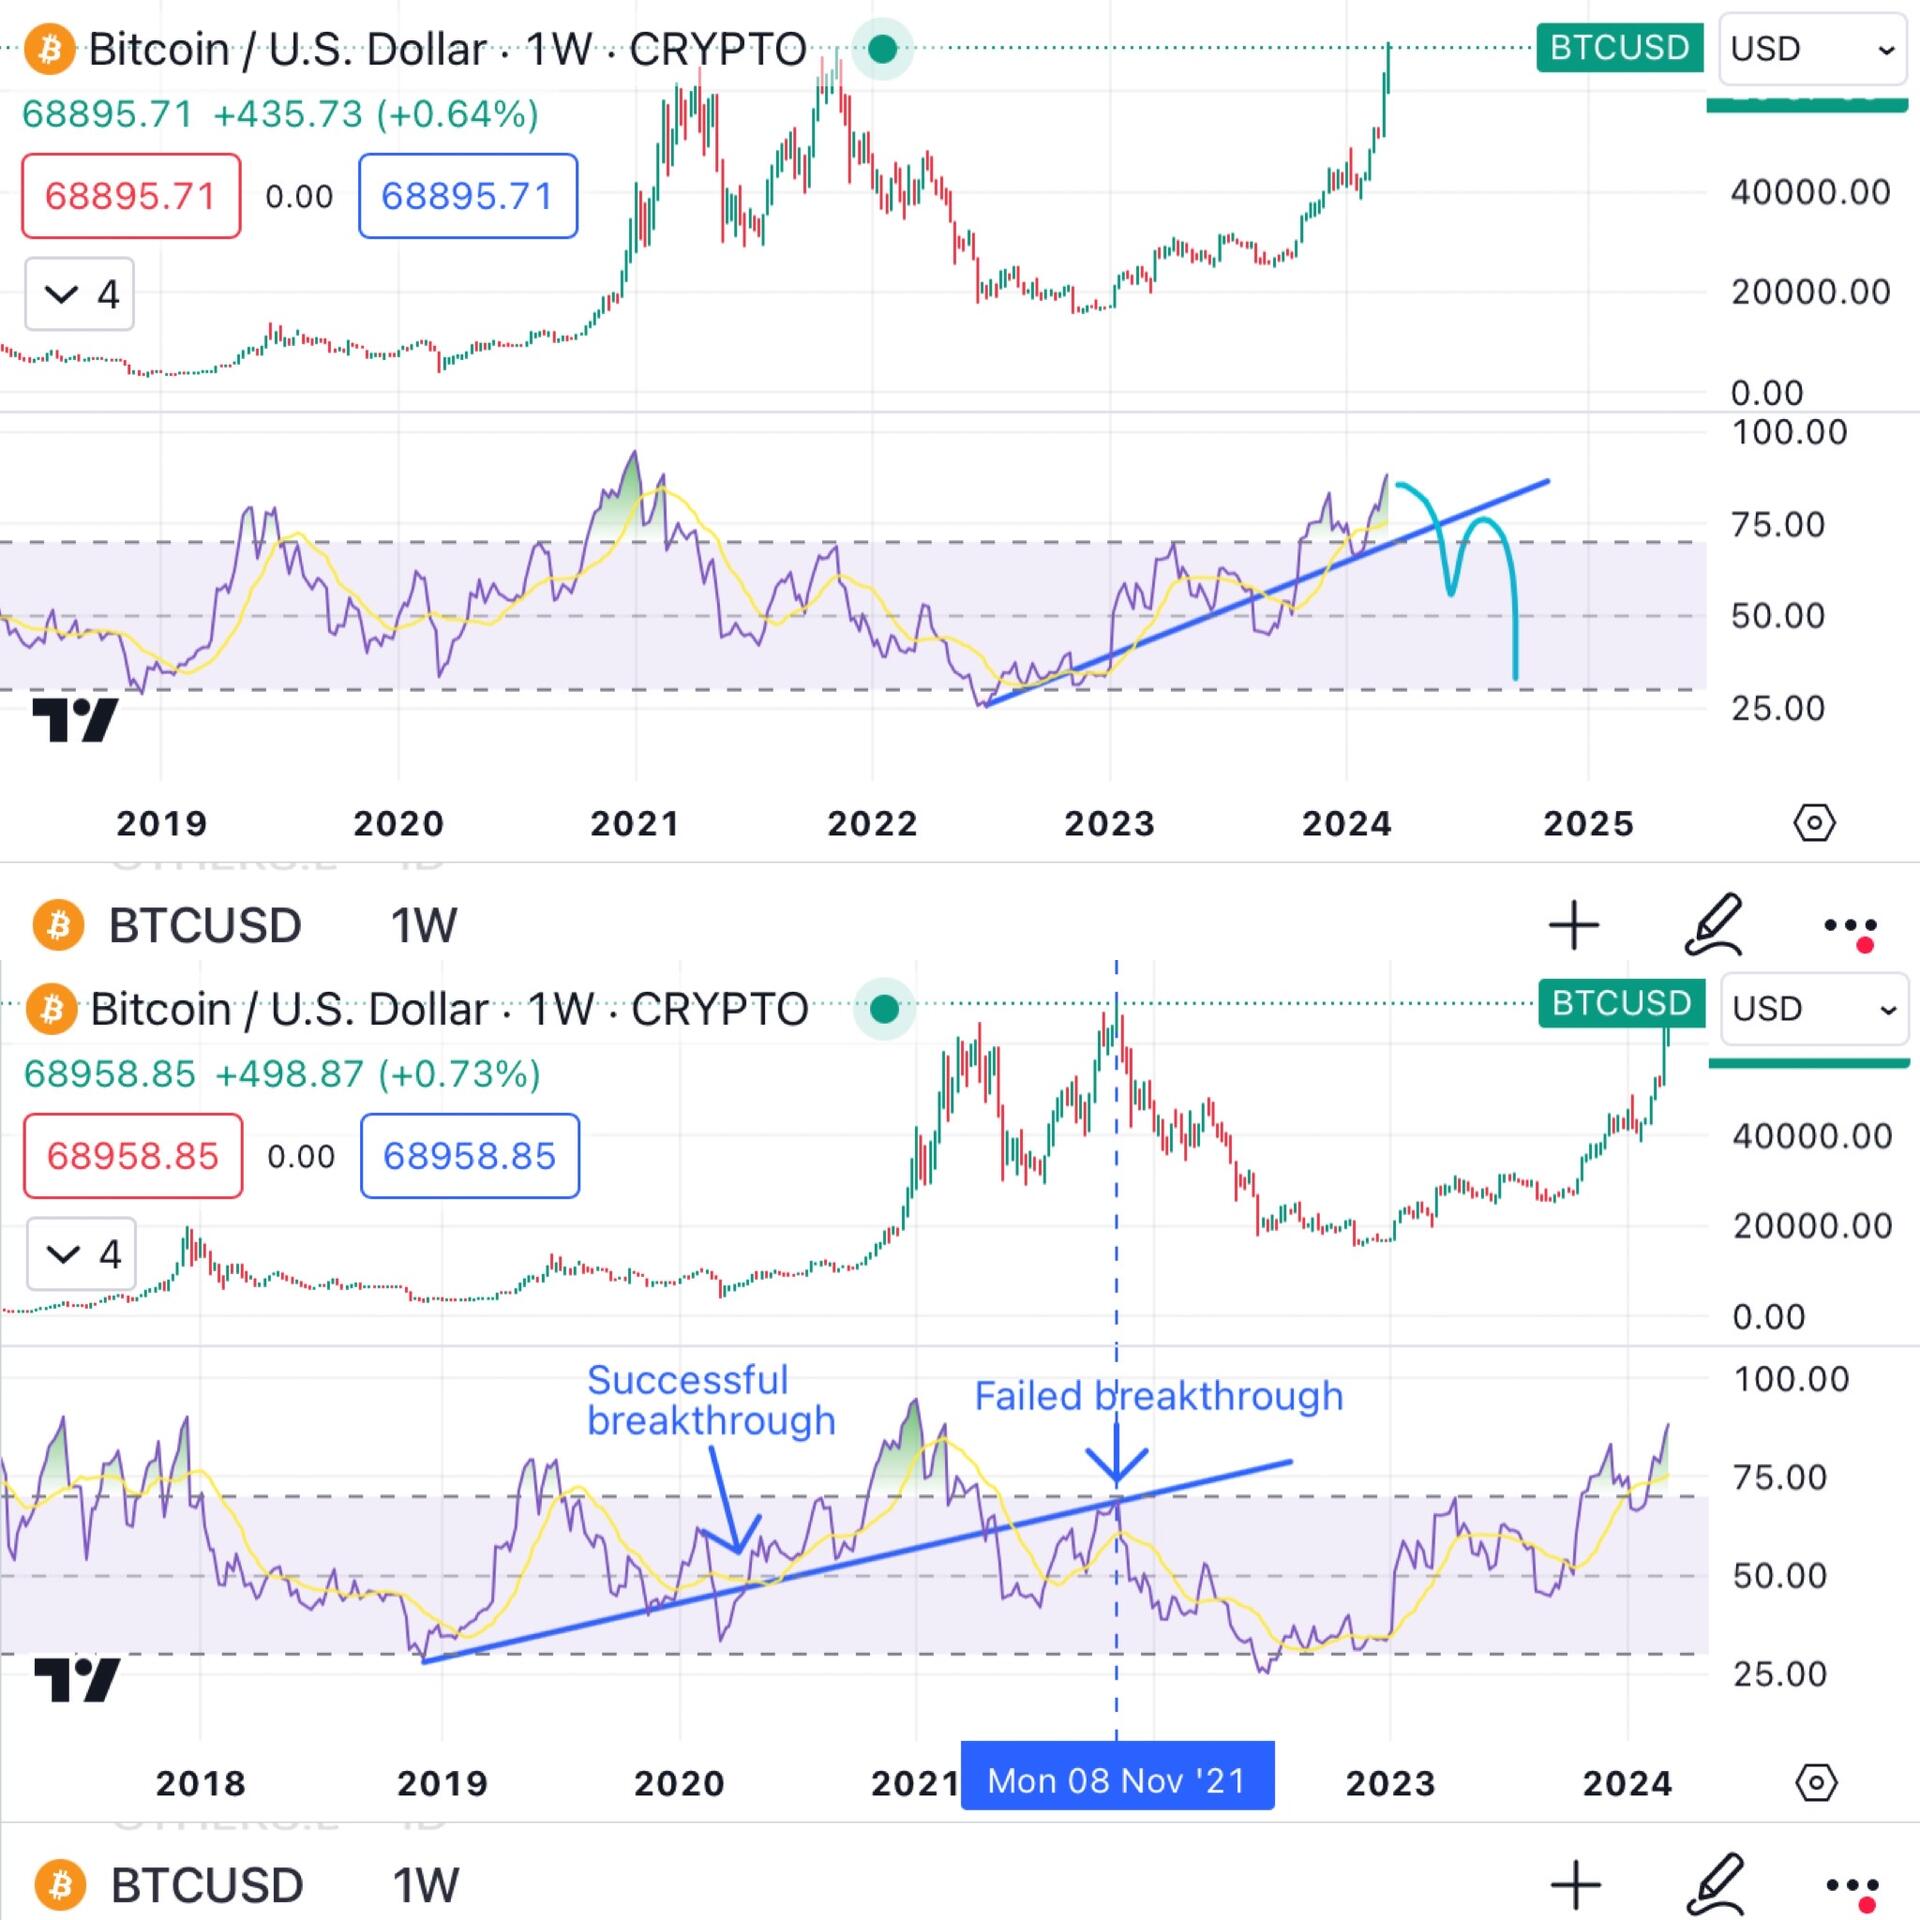
$AMC vs #BTC. It’s a possibility AMC is printing a bullish megaphone pattern. It’s one way to interpret it.
#AMC’s RSI is getting squeezed. Watching it to see which direction price action will break to. 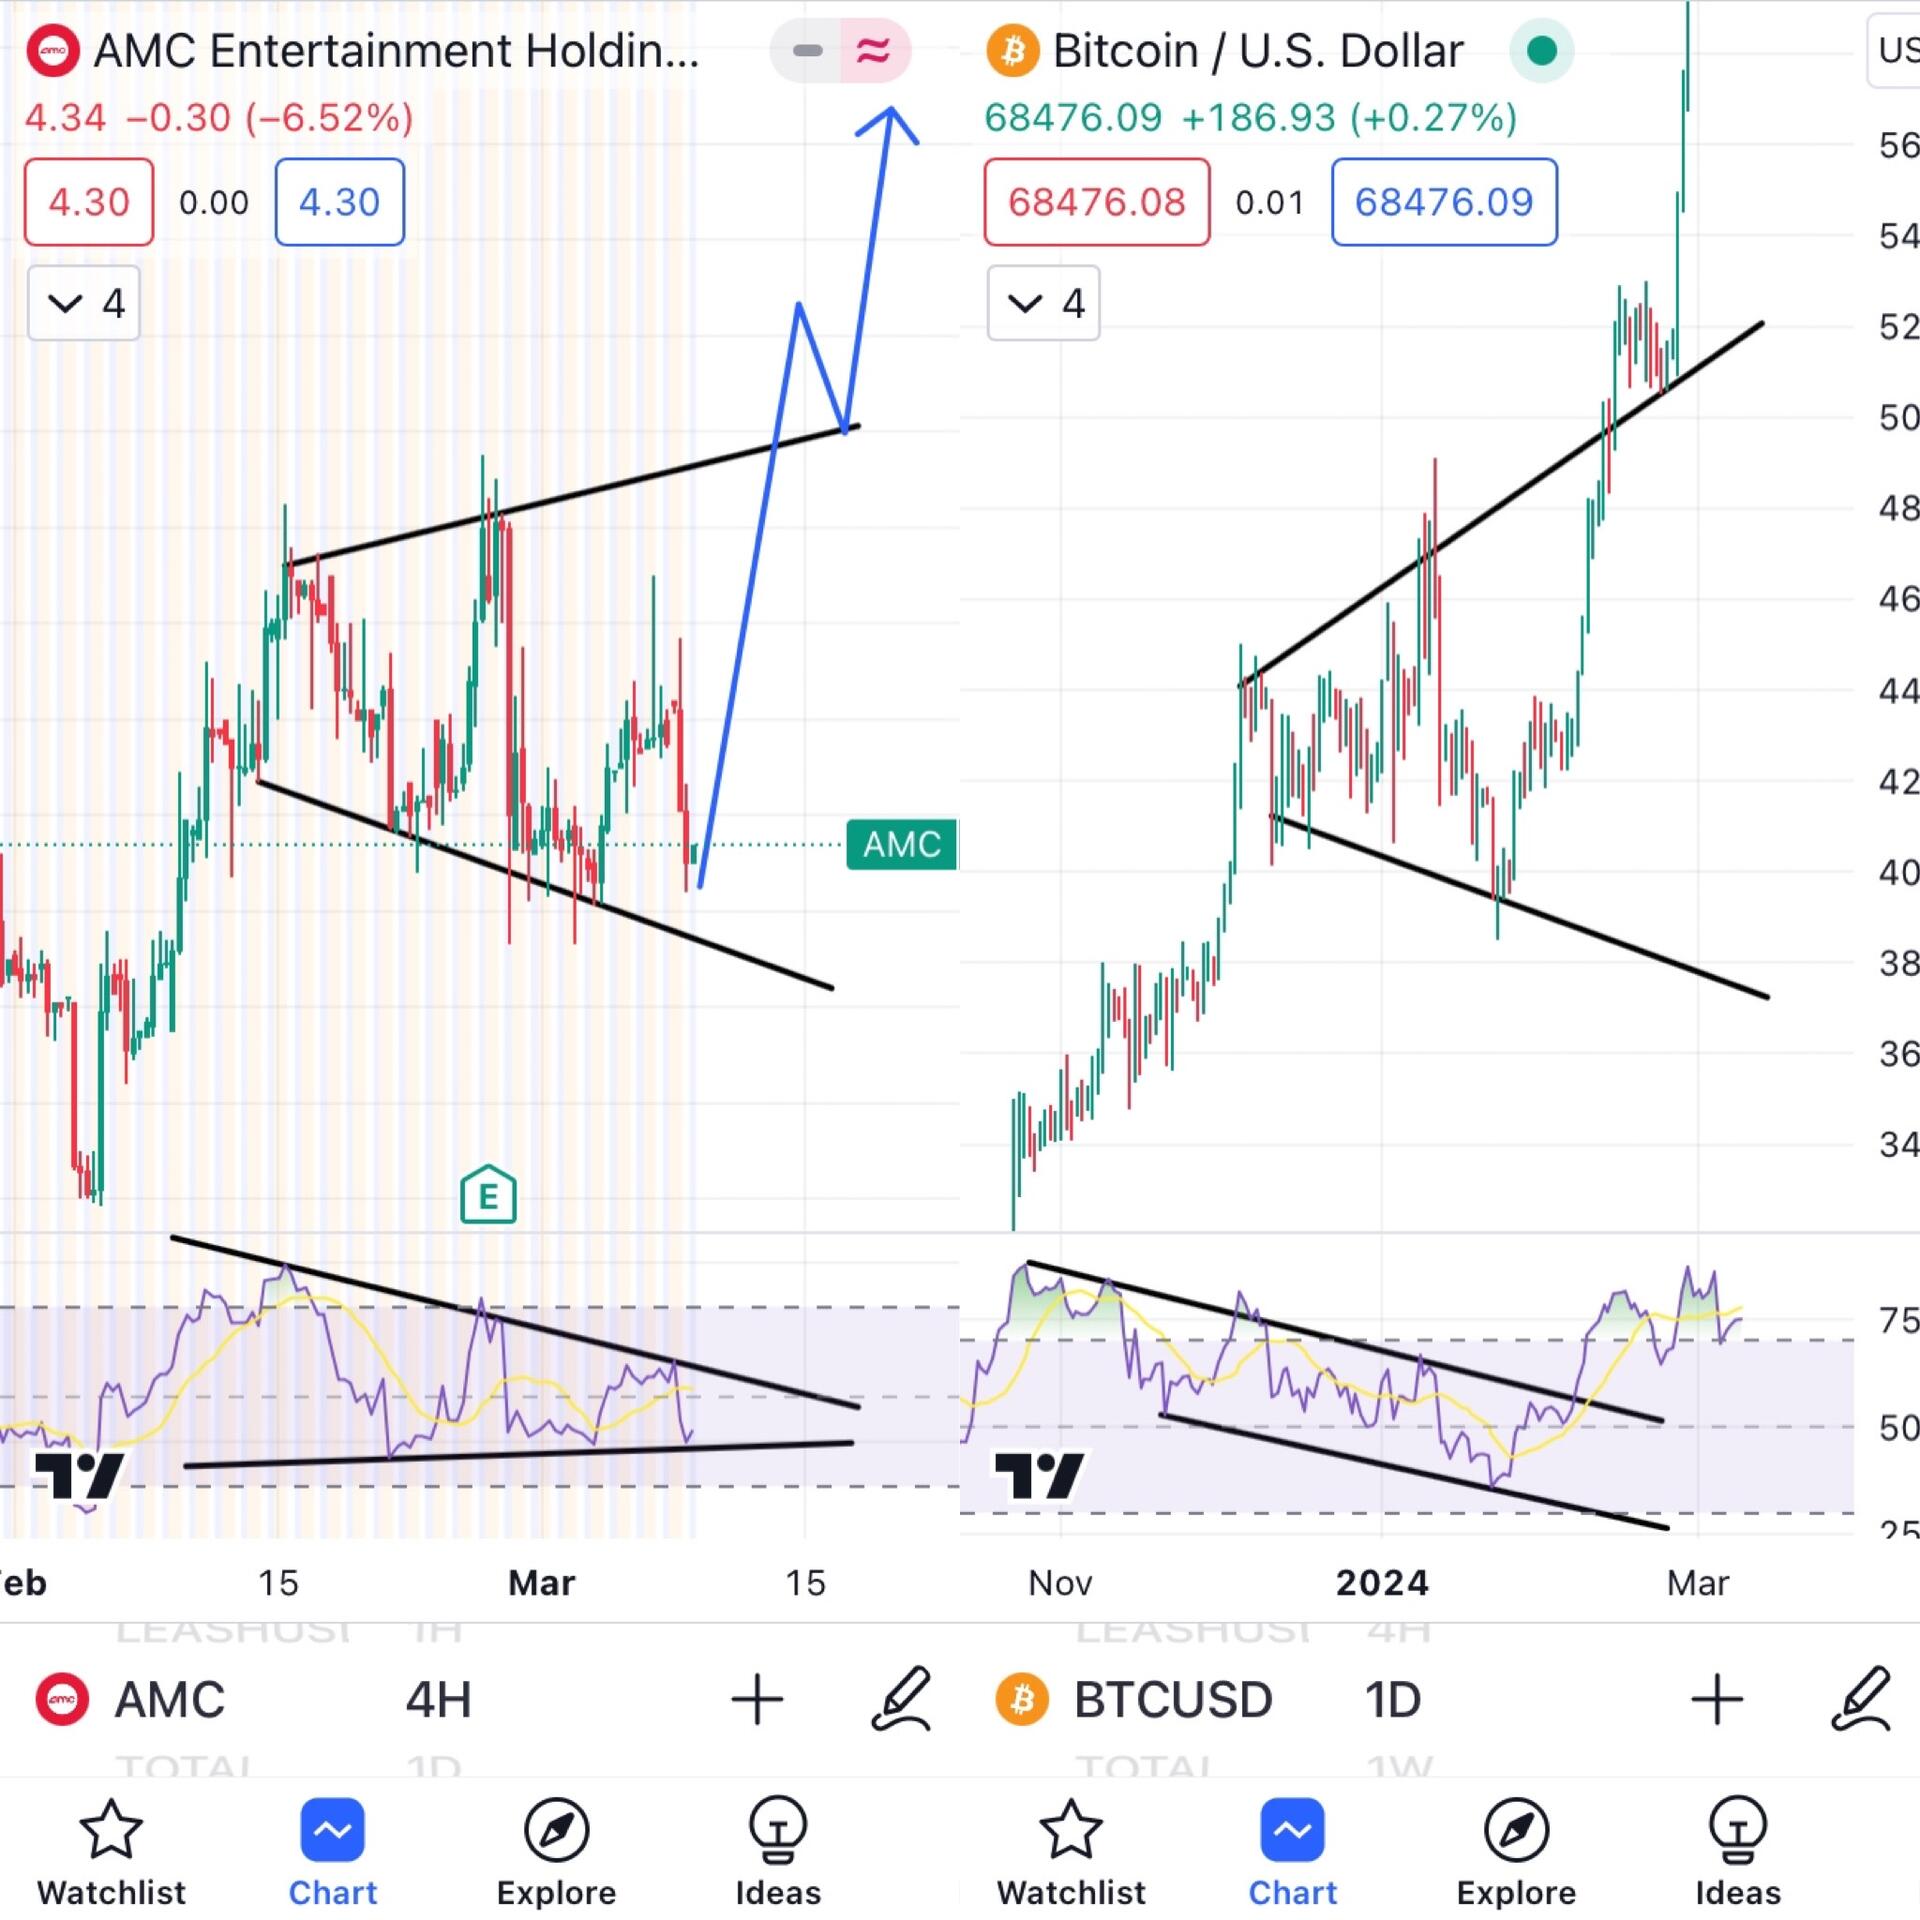
What phase of #Wycoff are we in? #AMC compared to #BTC. 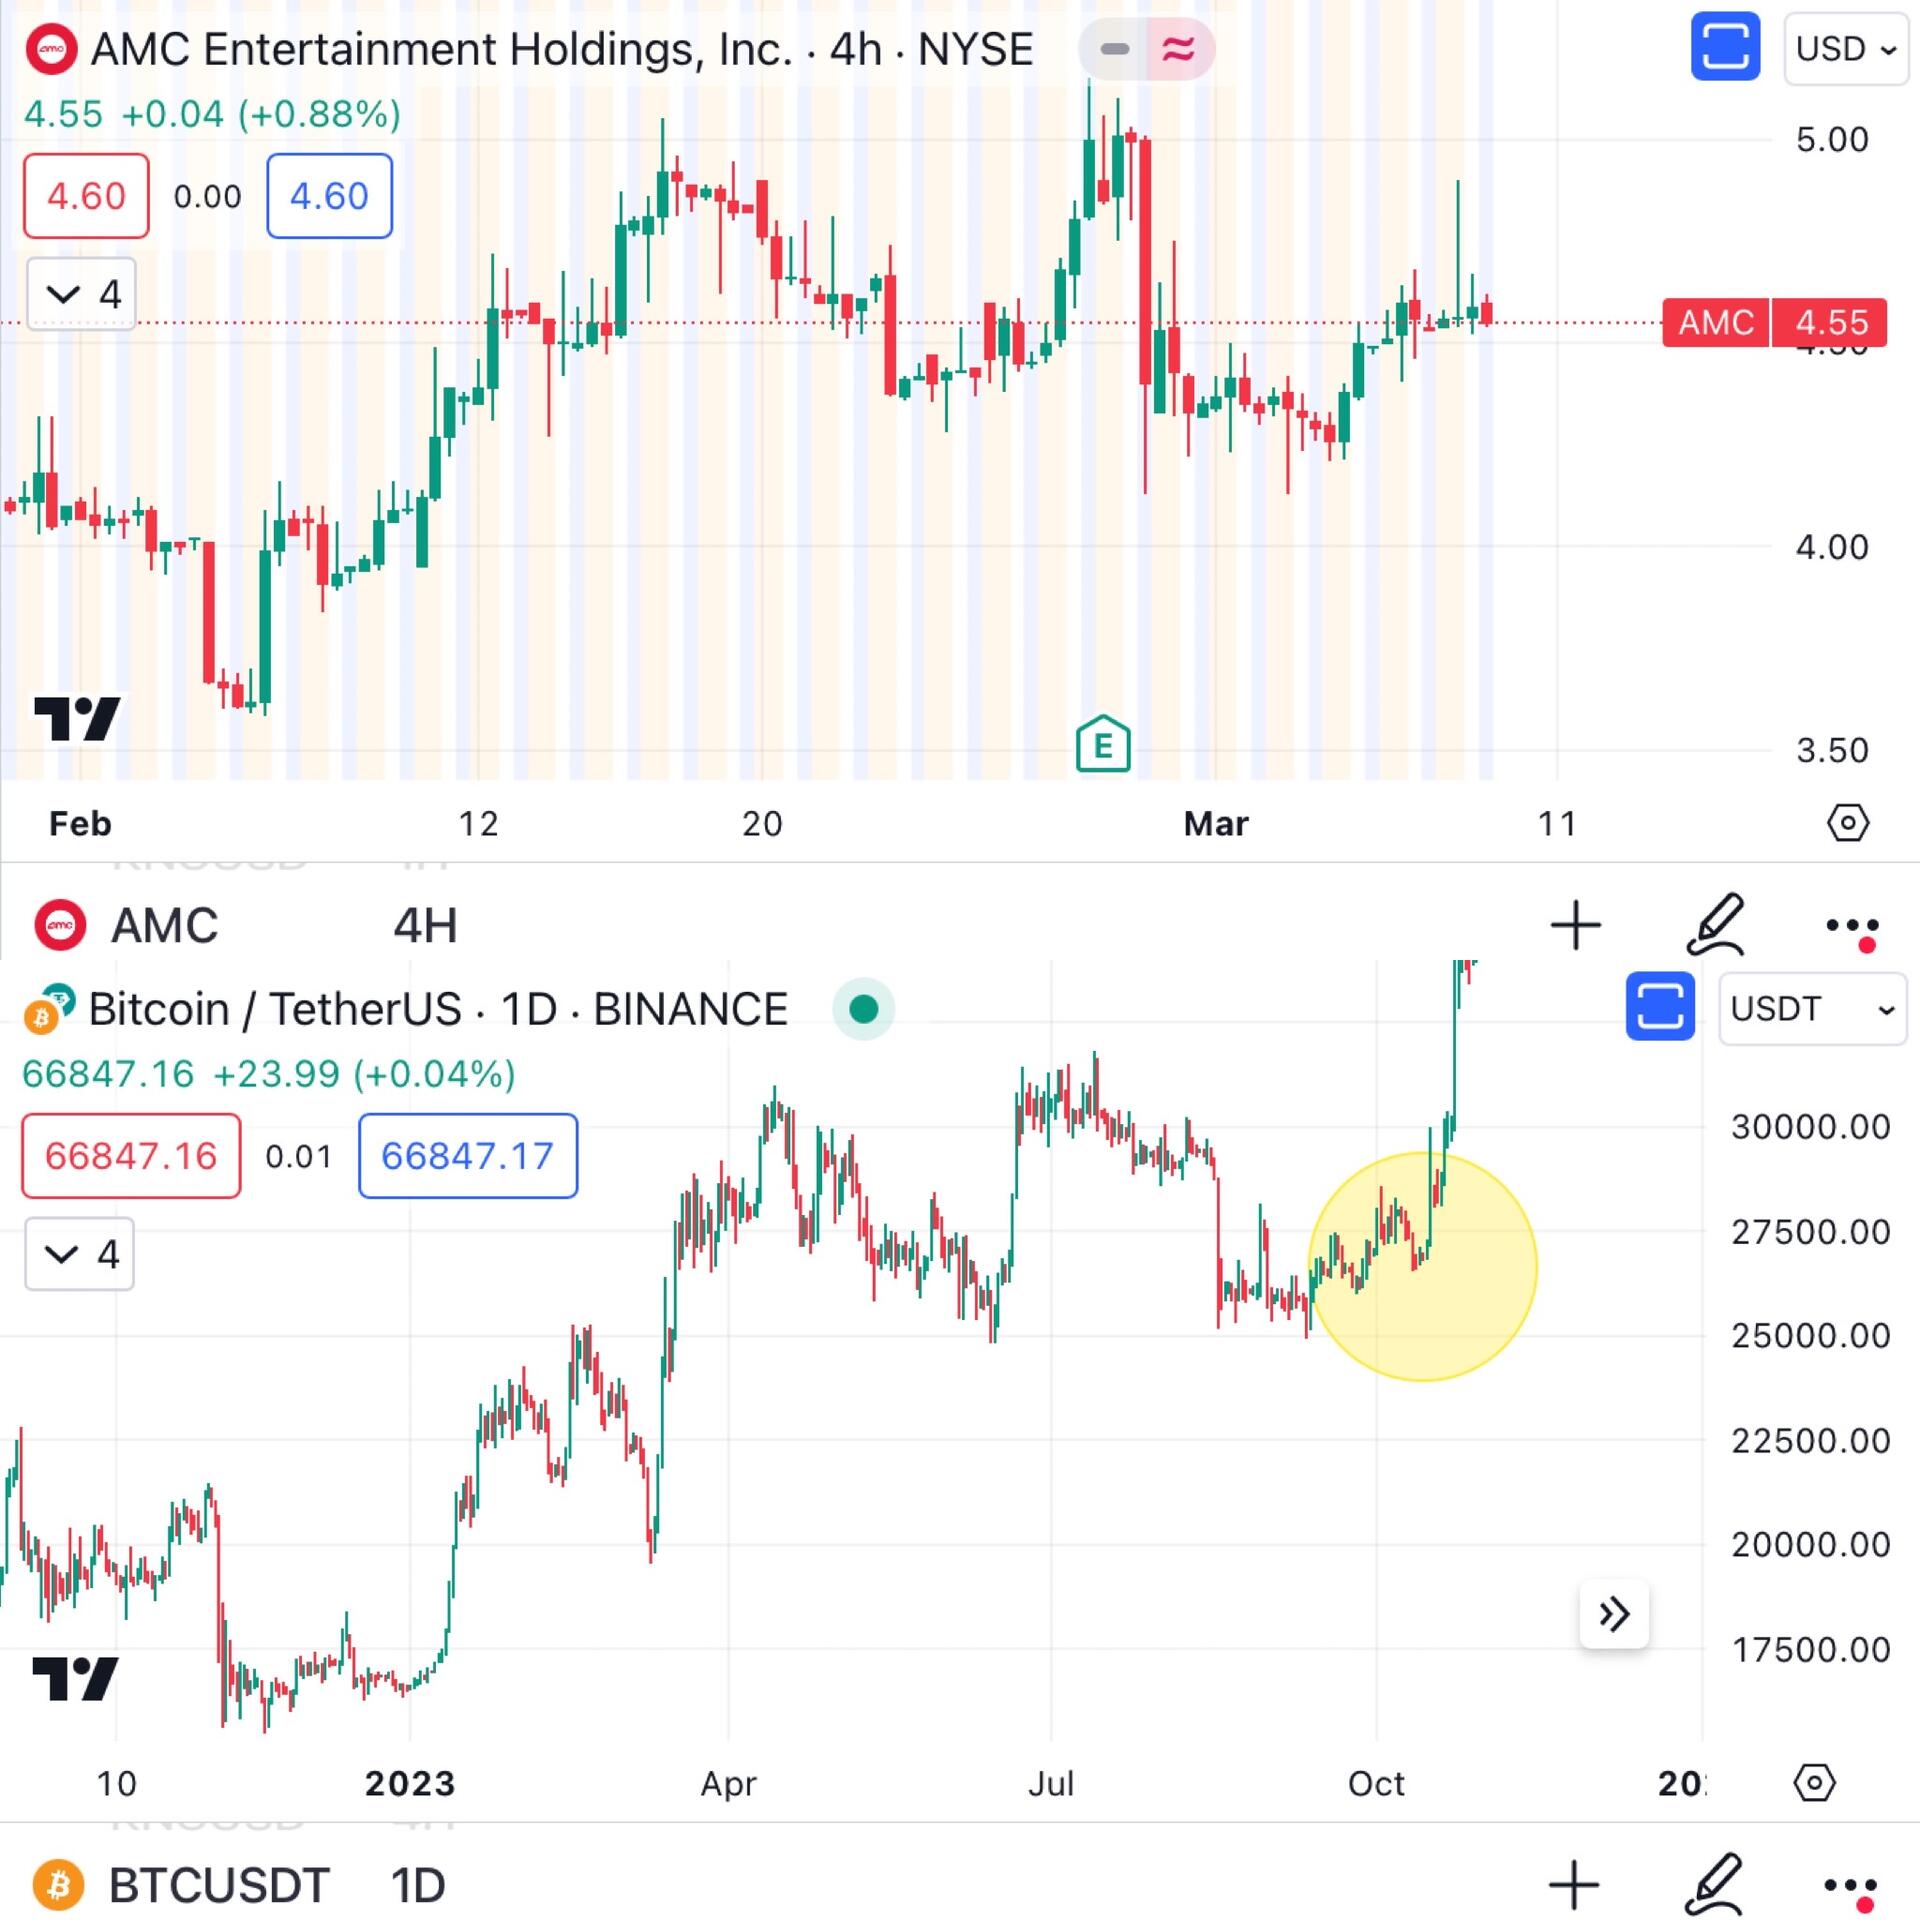
$SHIB has been following a trend line, making higher highs and higher lows.
#SHIB is also forming a triangle. Watching it to see to which side it will break to. Keep an eye on it! 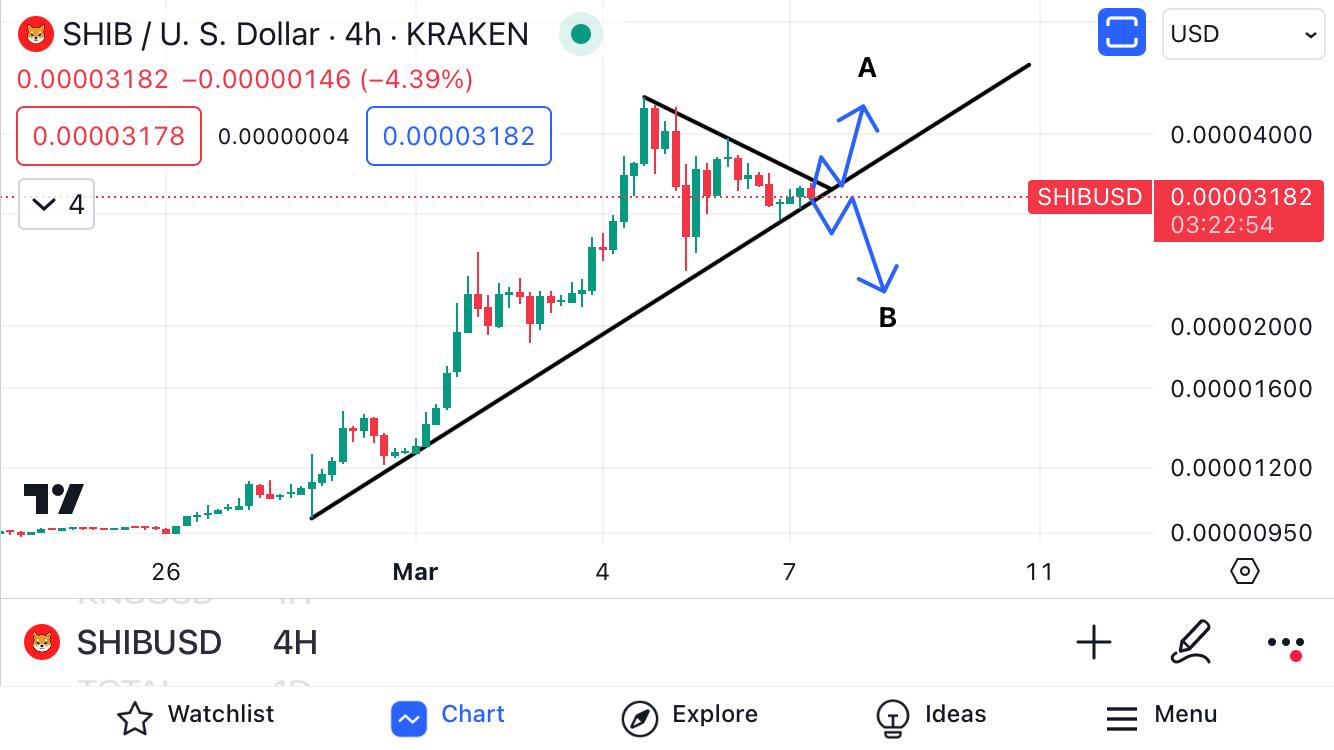
$BTC continues to make higher highs and higher lows. Bull run is NOT over.
However, #BTC flash crash did not mitigate the FVG completely. I expect #Bitcoin price action to mitigate it at least halfway, then continue its ascent. 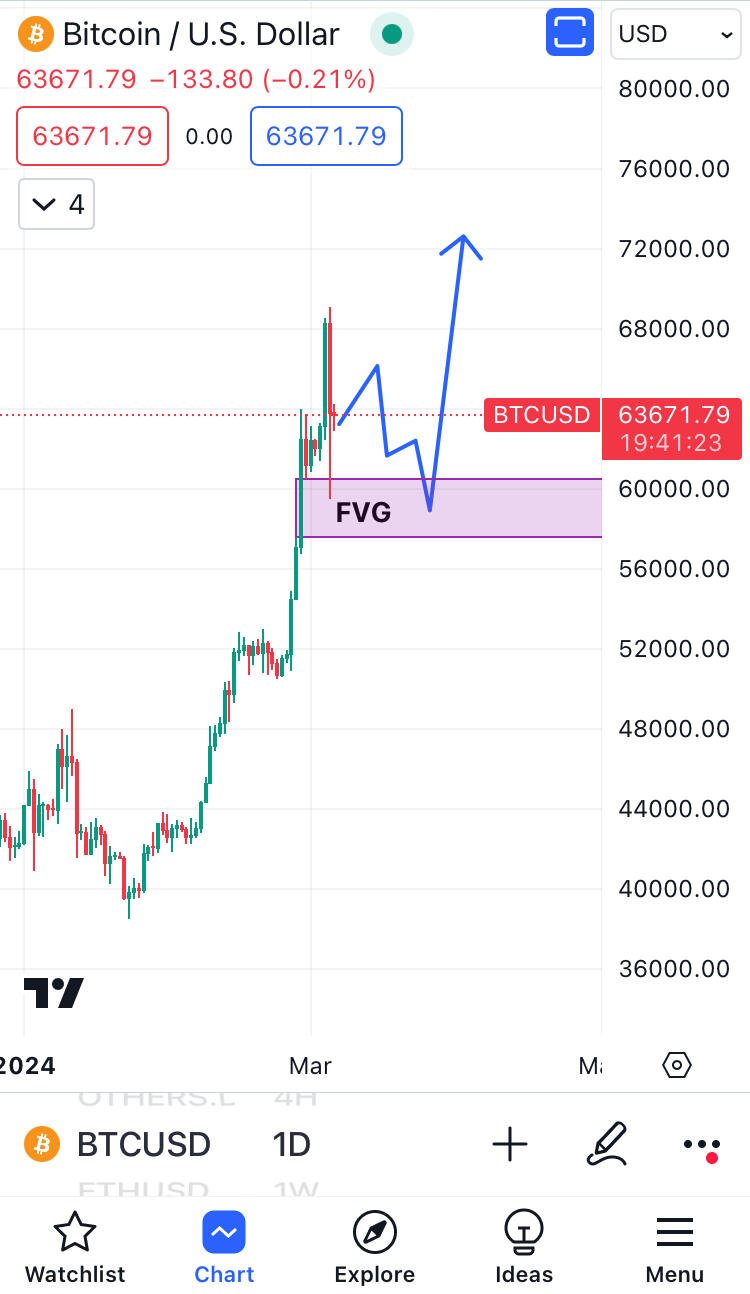
$DOGE from 2014-2017, #DOGE from 2018-2021, and DOGE from 2022-2025?
Can #Dogecoin repeat a 4th time? Or is a three-peat the max? 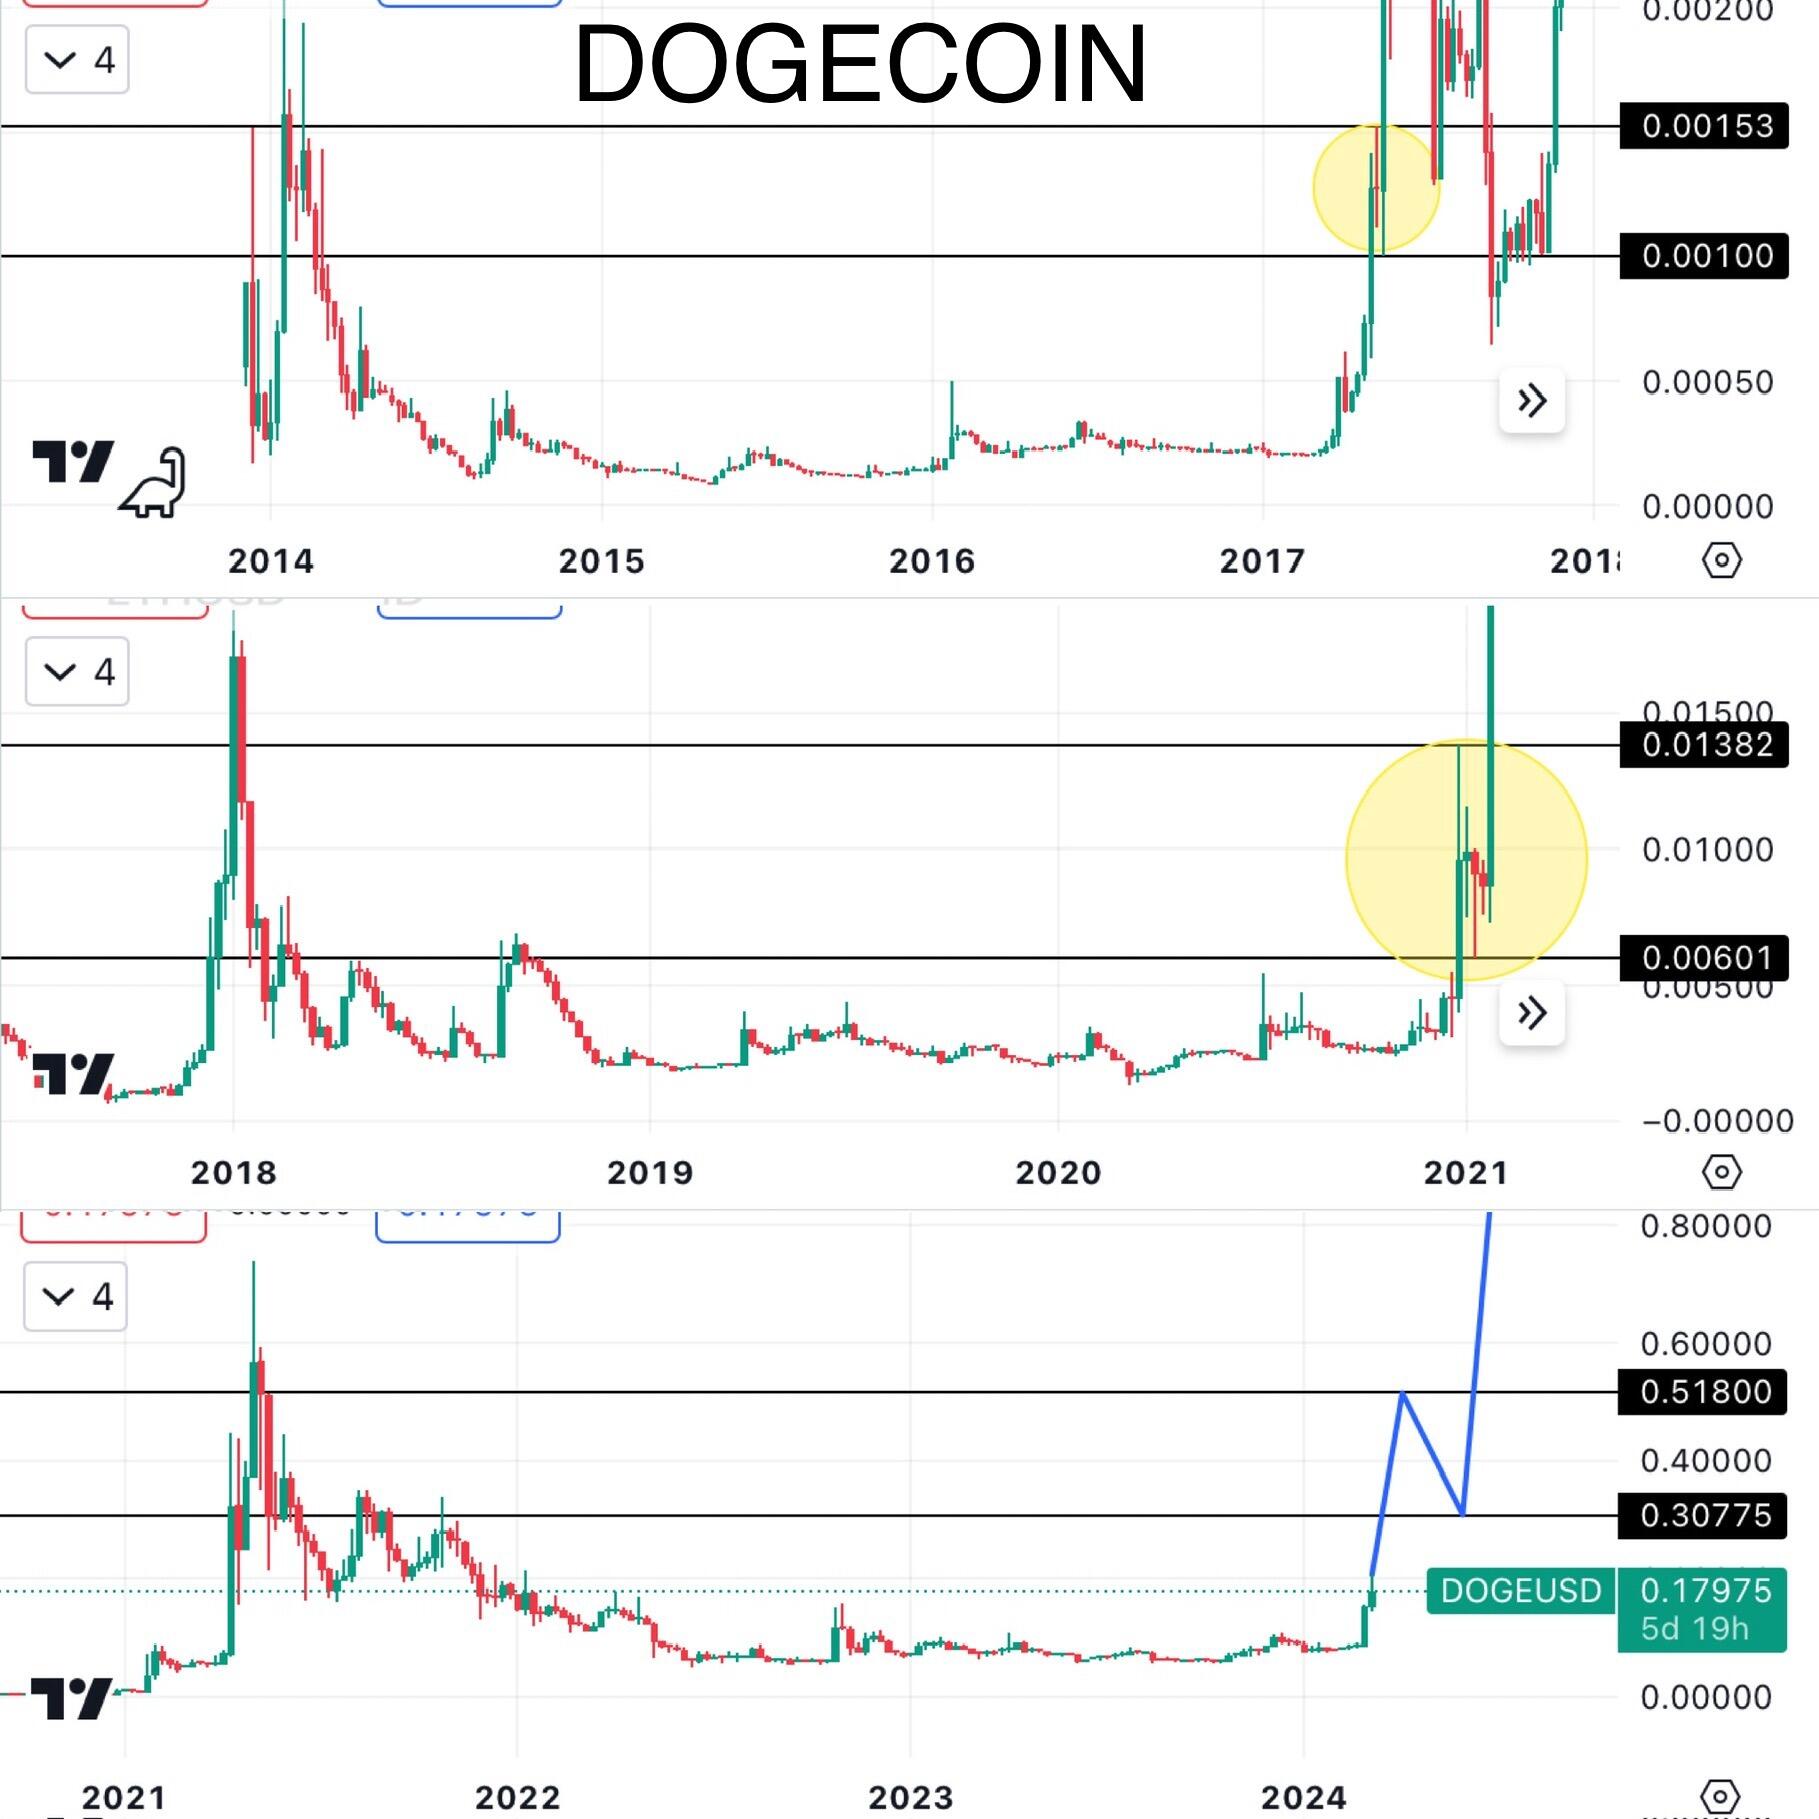
$SHIB 2024 vs $DOGE 2017.
If #SHIB continues to follow #DOGE’s path, there’ll be one more chance to accumulate at a discount, before it goes to the moon. 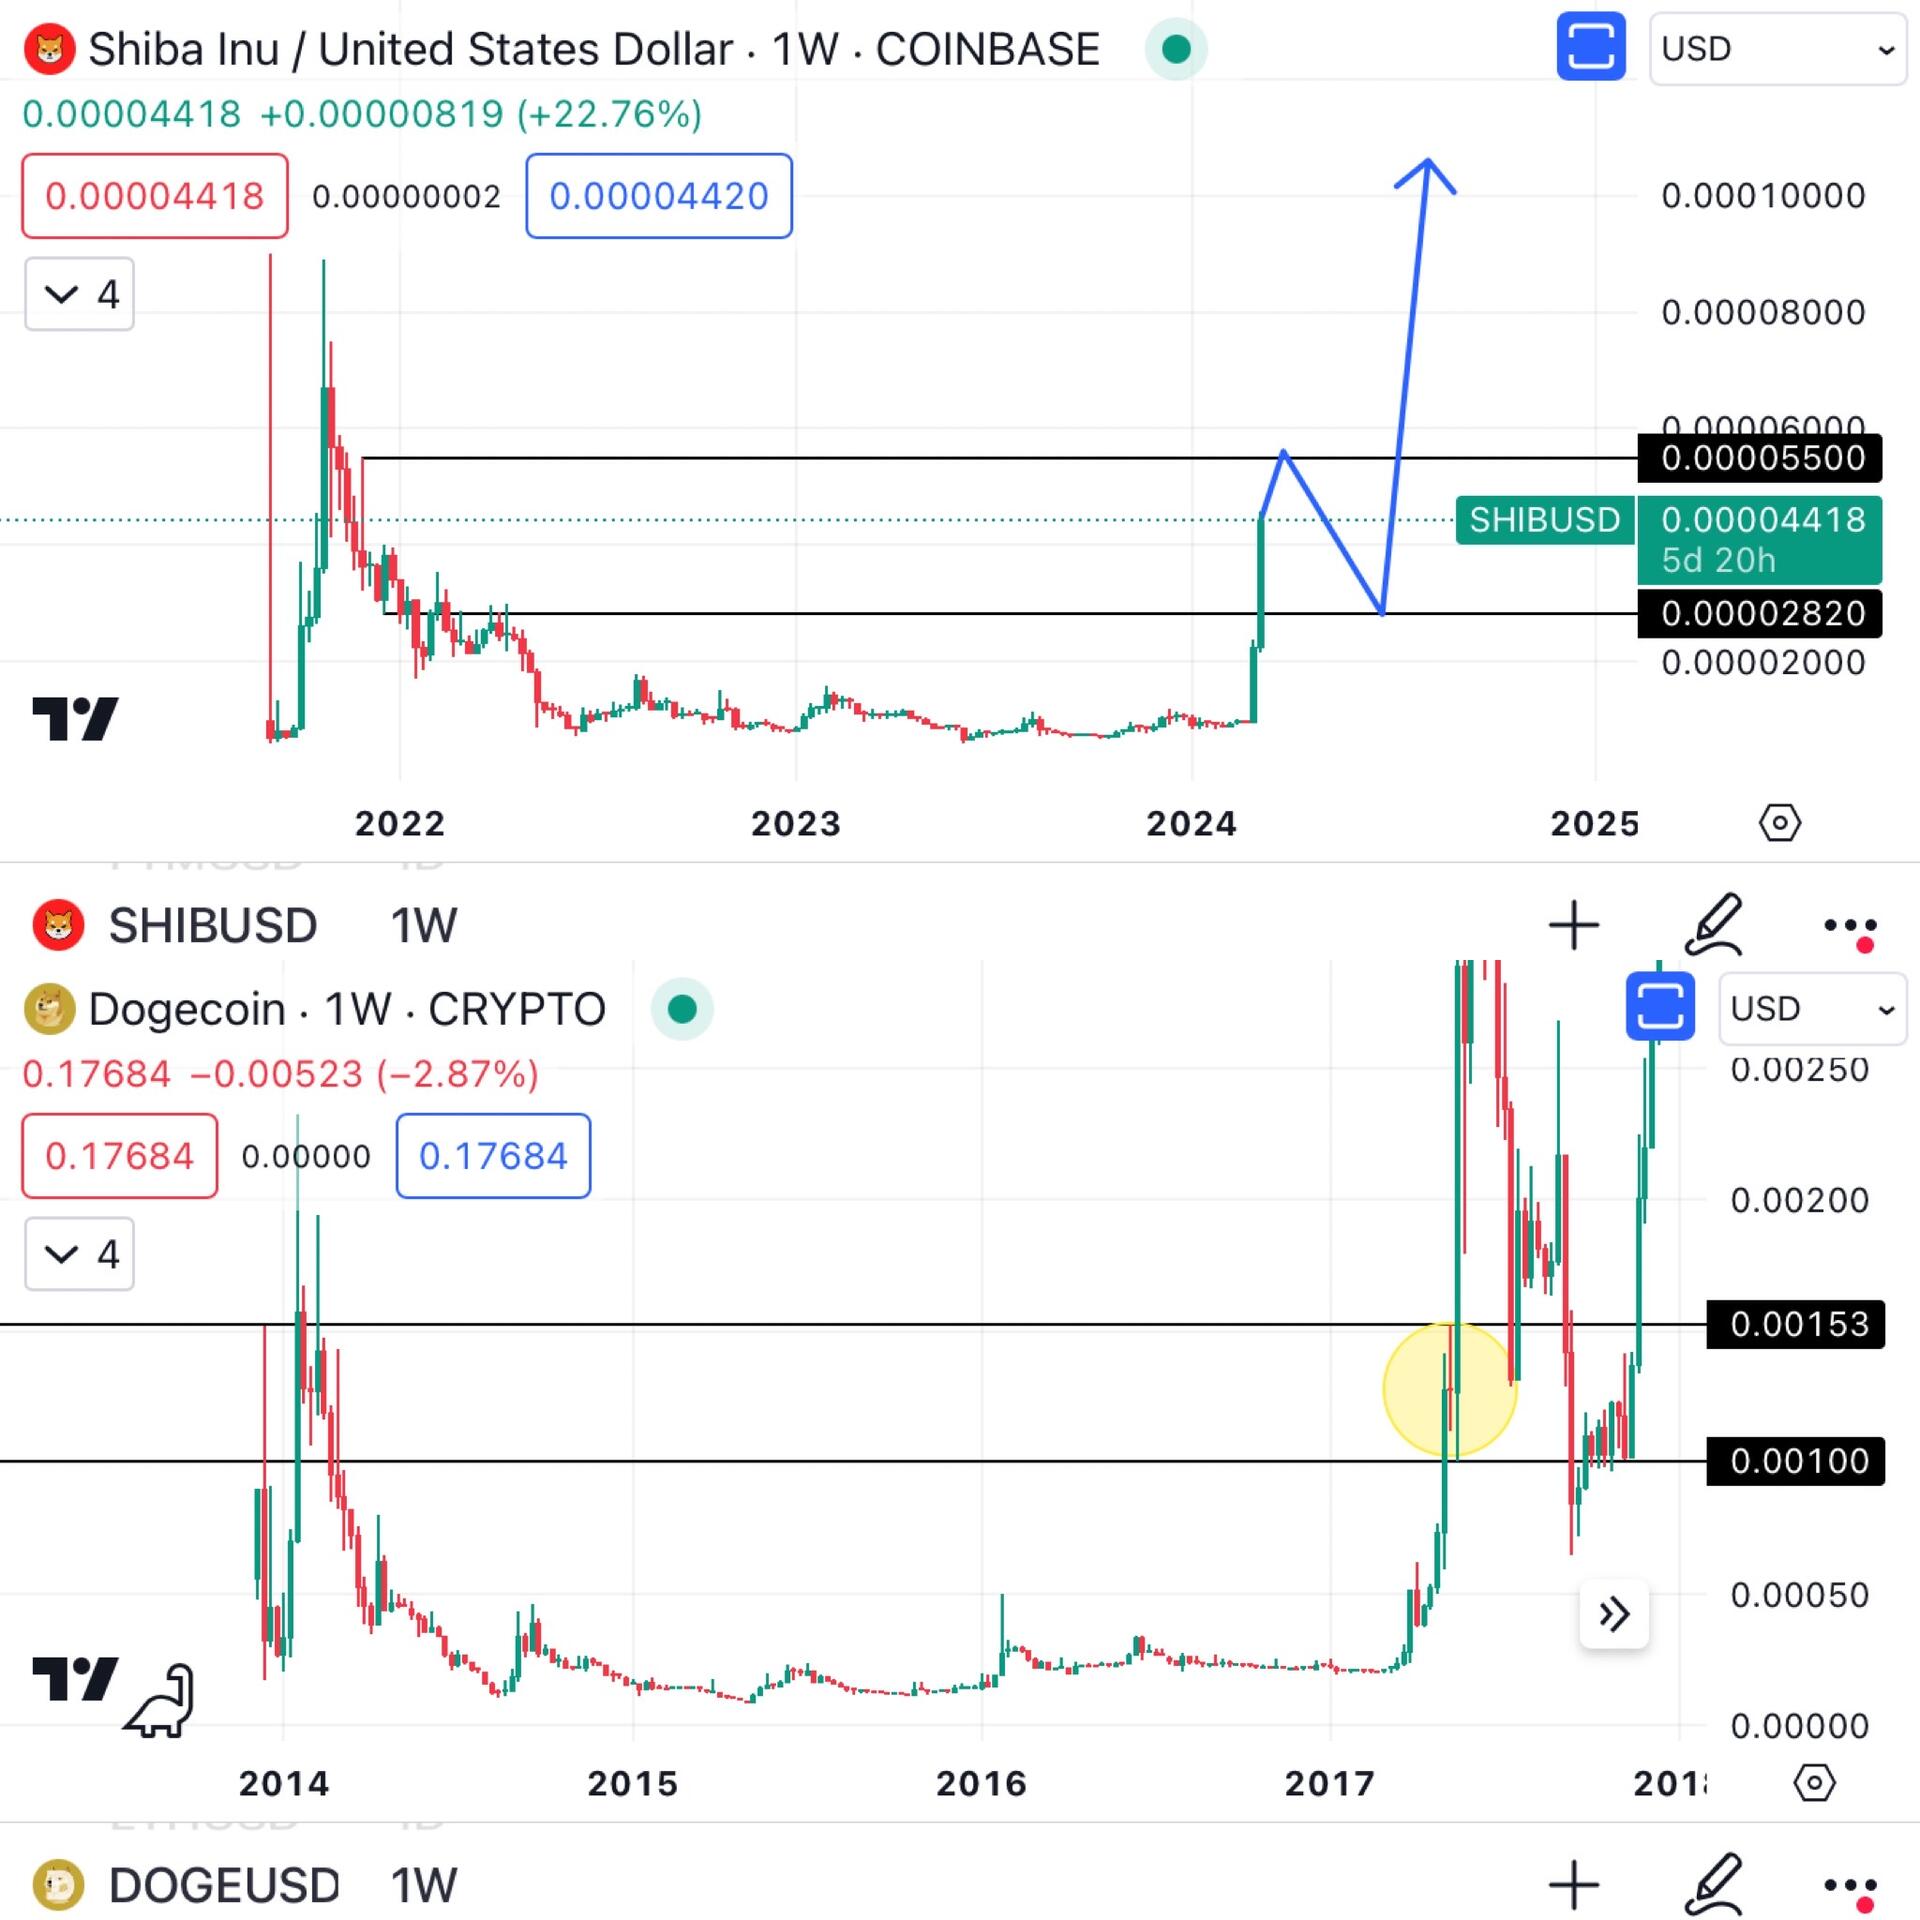
#Fantom is killing it, up 13% already today, working on its sign of strength phase.
If $FTM is going to continue to follow #Wycoff accumulation, then your last chance to accumulate more at a discount, is at the retest, before #FTM blasts off. 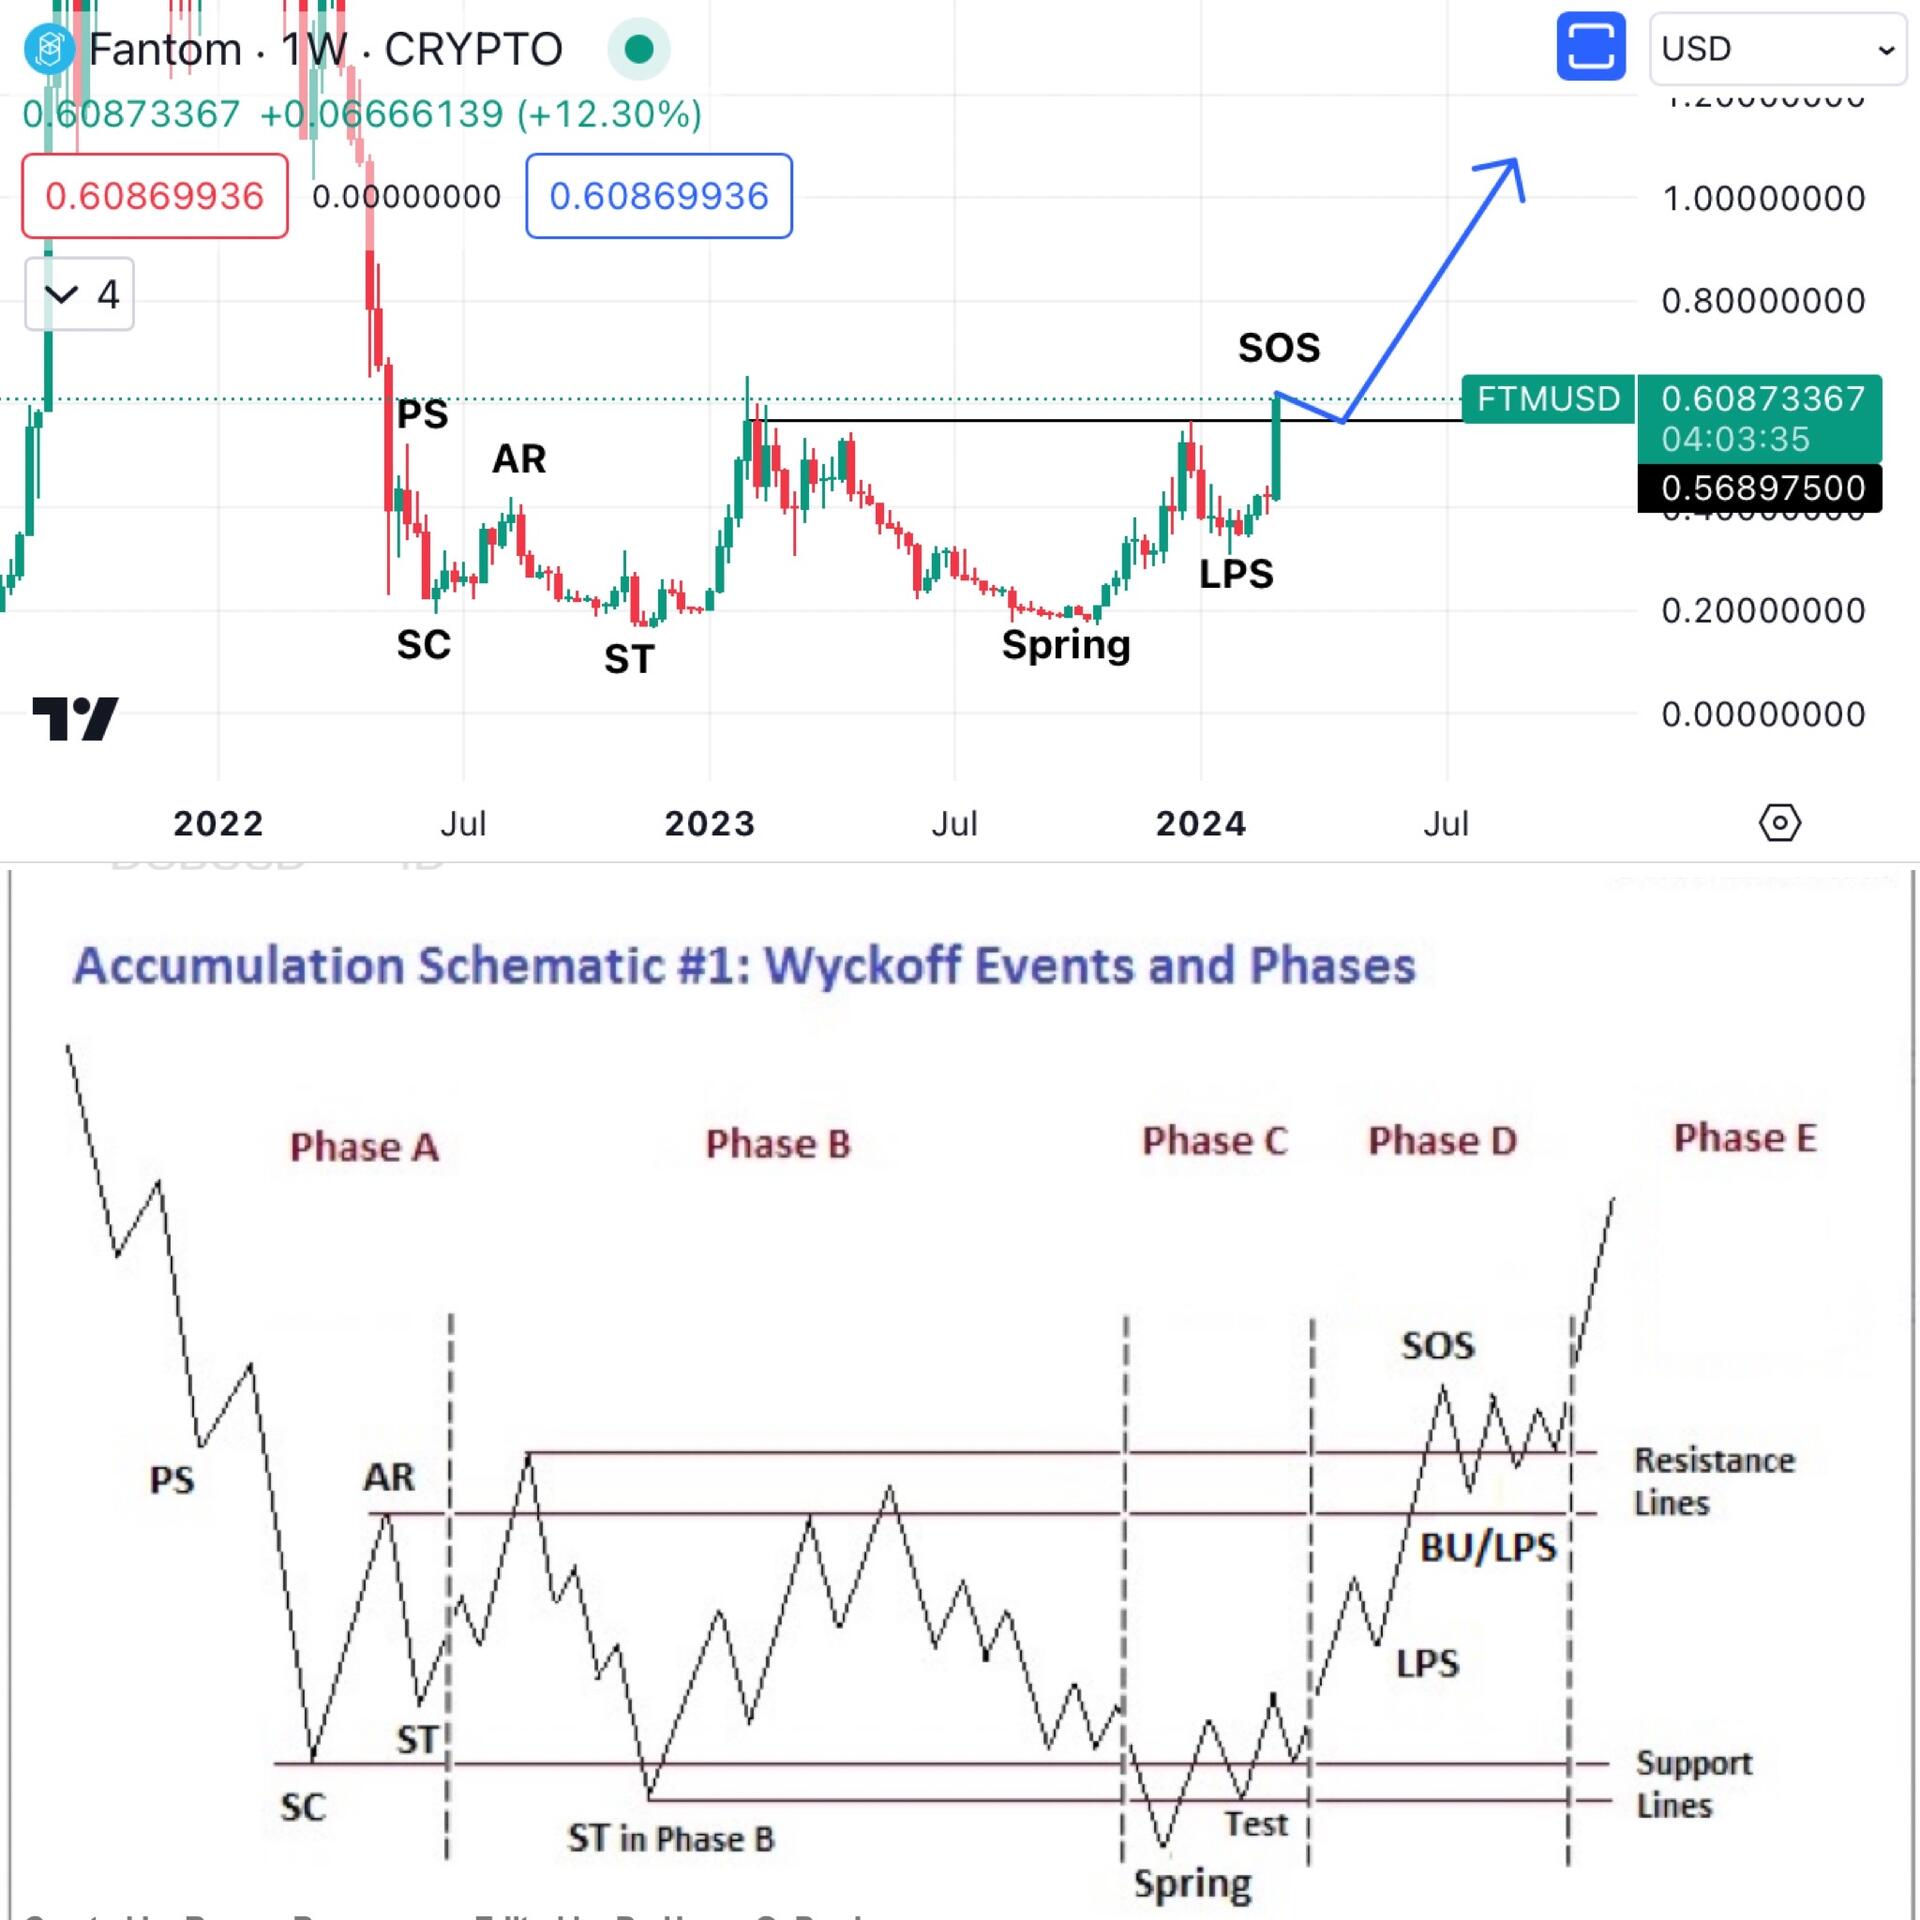
I never really paid much attention to #BitcoinCash until today.
If $BCH has been in Wycoff Accumulation its entire life cycle, it’s possible that #BCH can reach back to its ATH… and maybe even beyond. 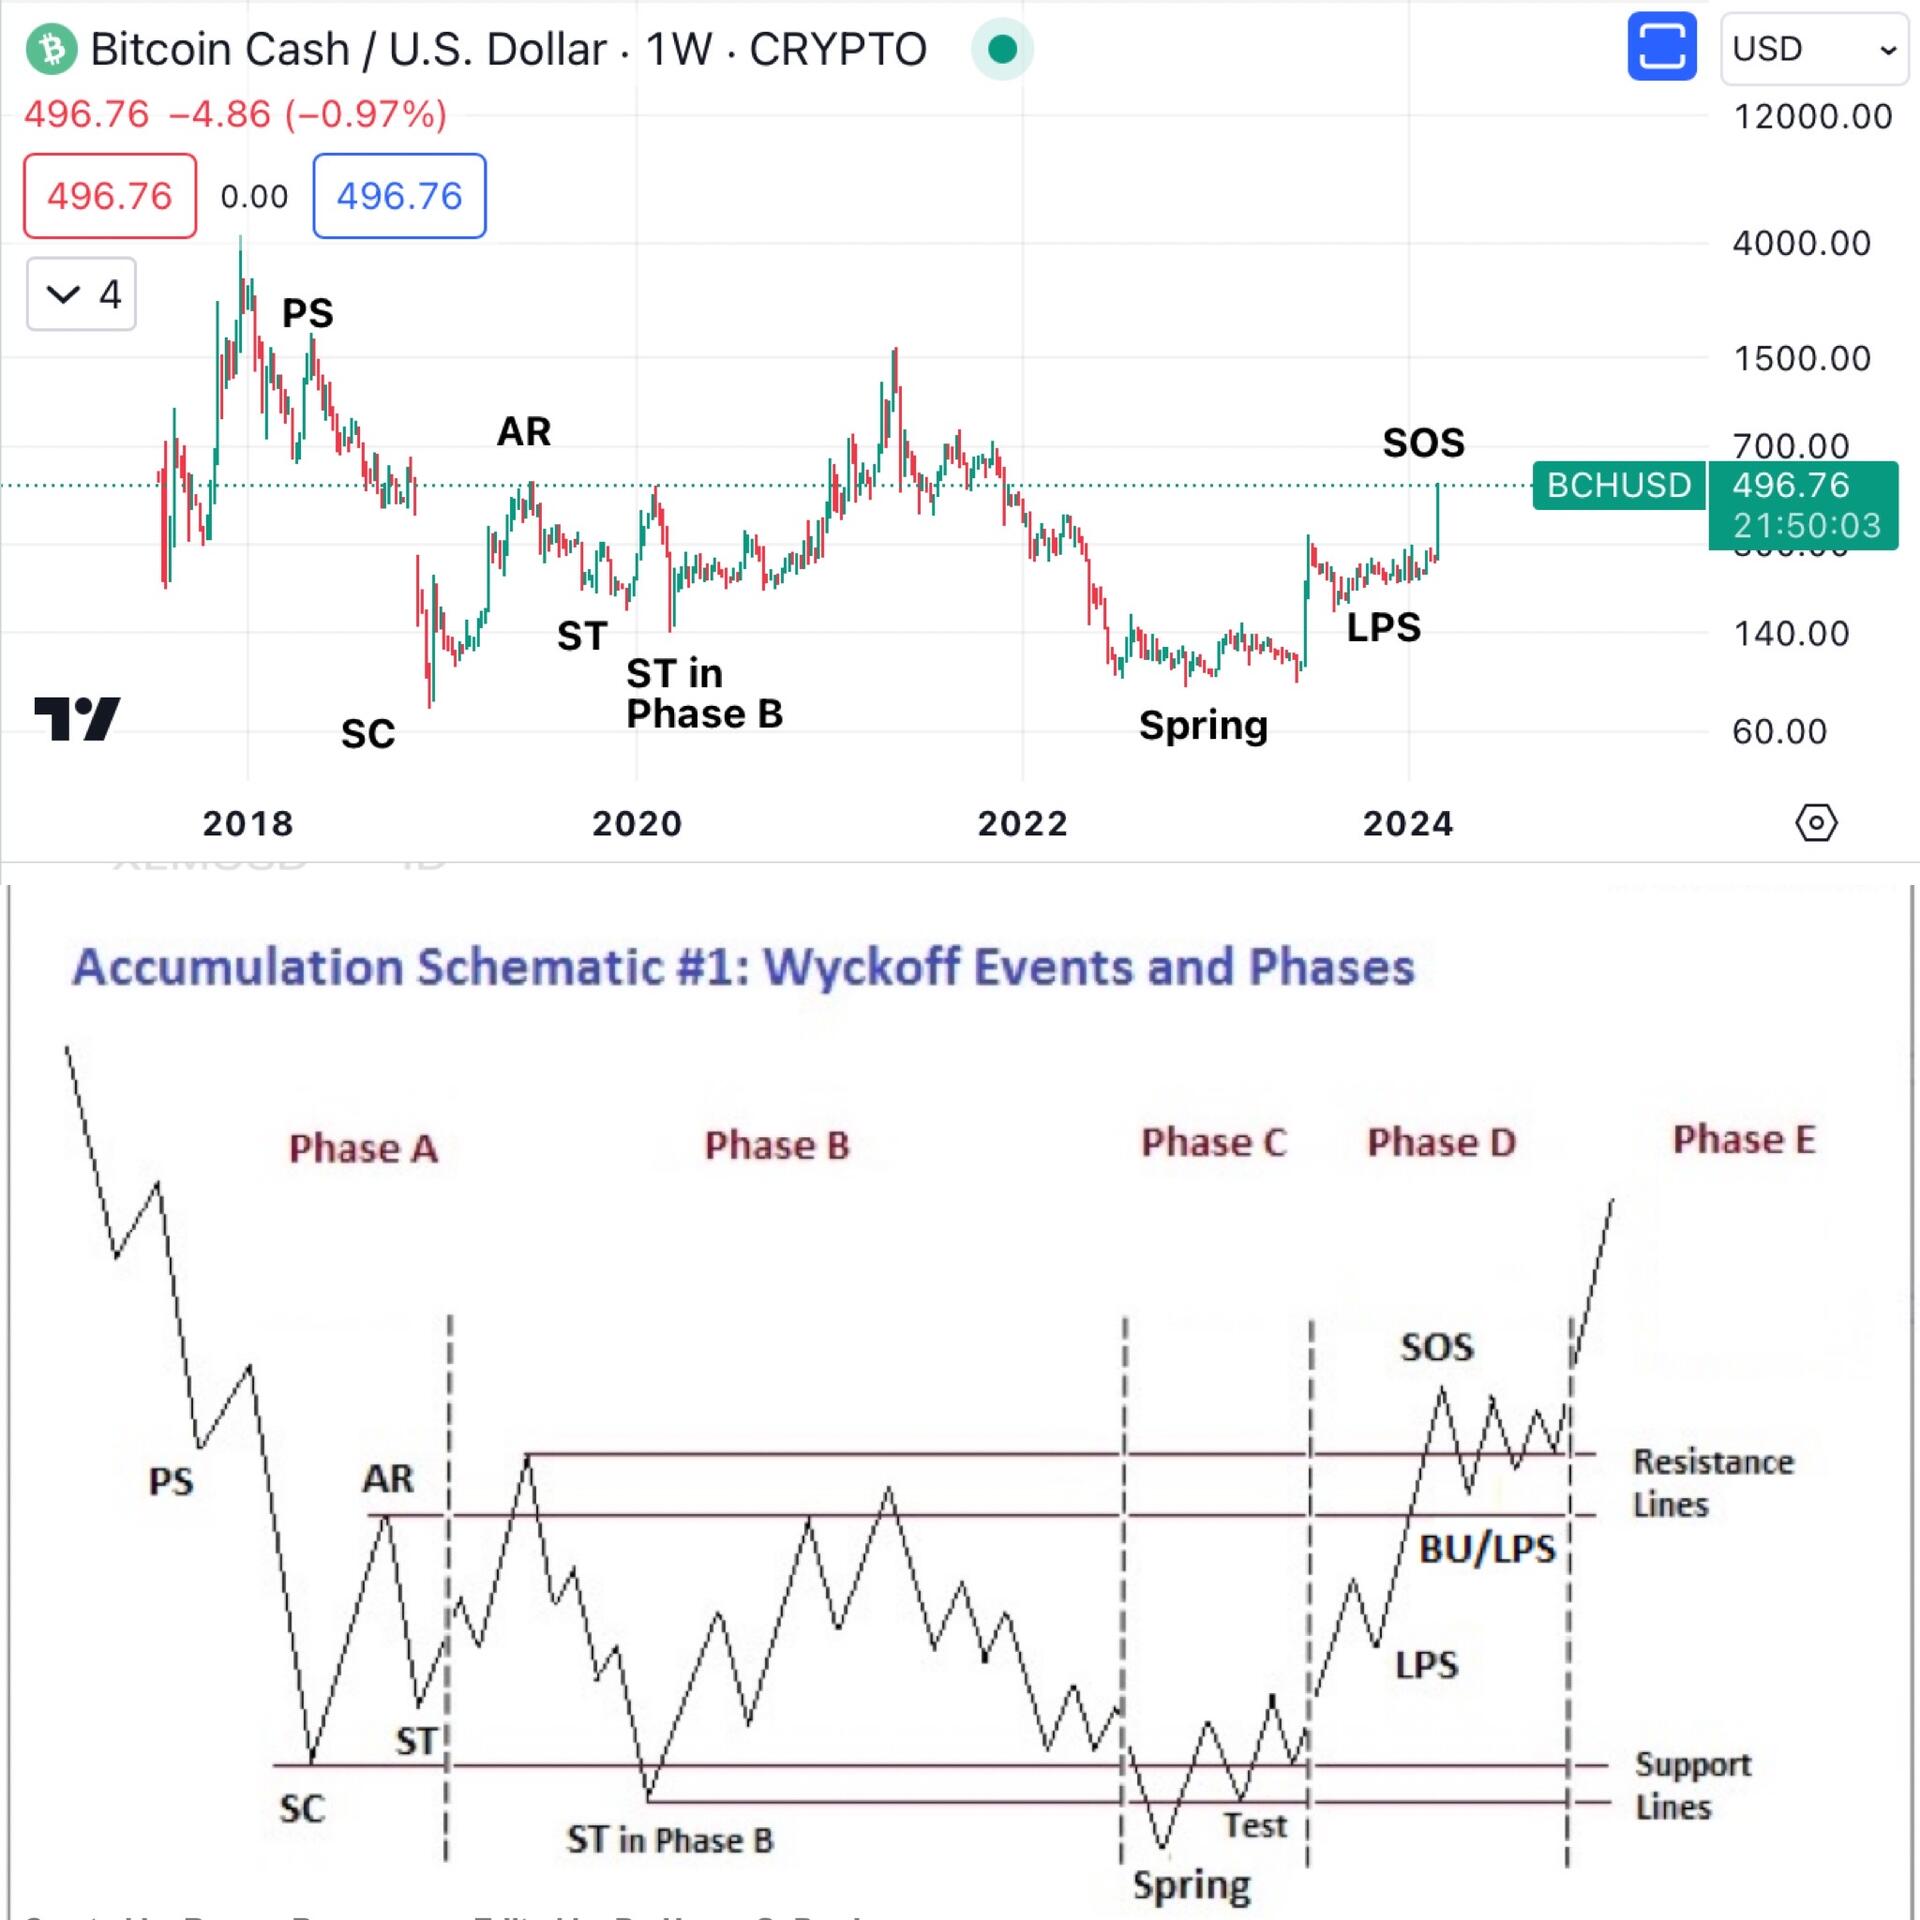
Typically in triangles, price action goes the opposite direction of Wave E.
That would mean that #BTC may head downwards soon. However, it’s not a hard rule for triangle patterns.
Take for example, #SMCI. Its triangle pattern would suggest downward price action, but instead, it broke to the upside, after hours. #Bitcoin #SuperMicro 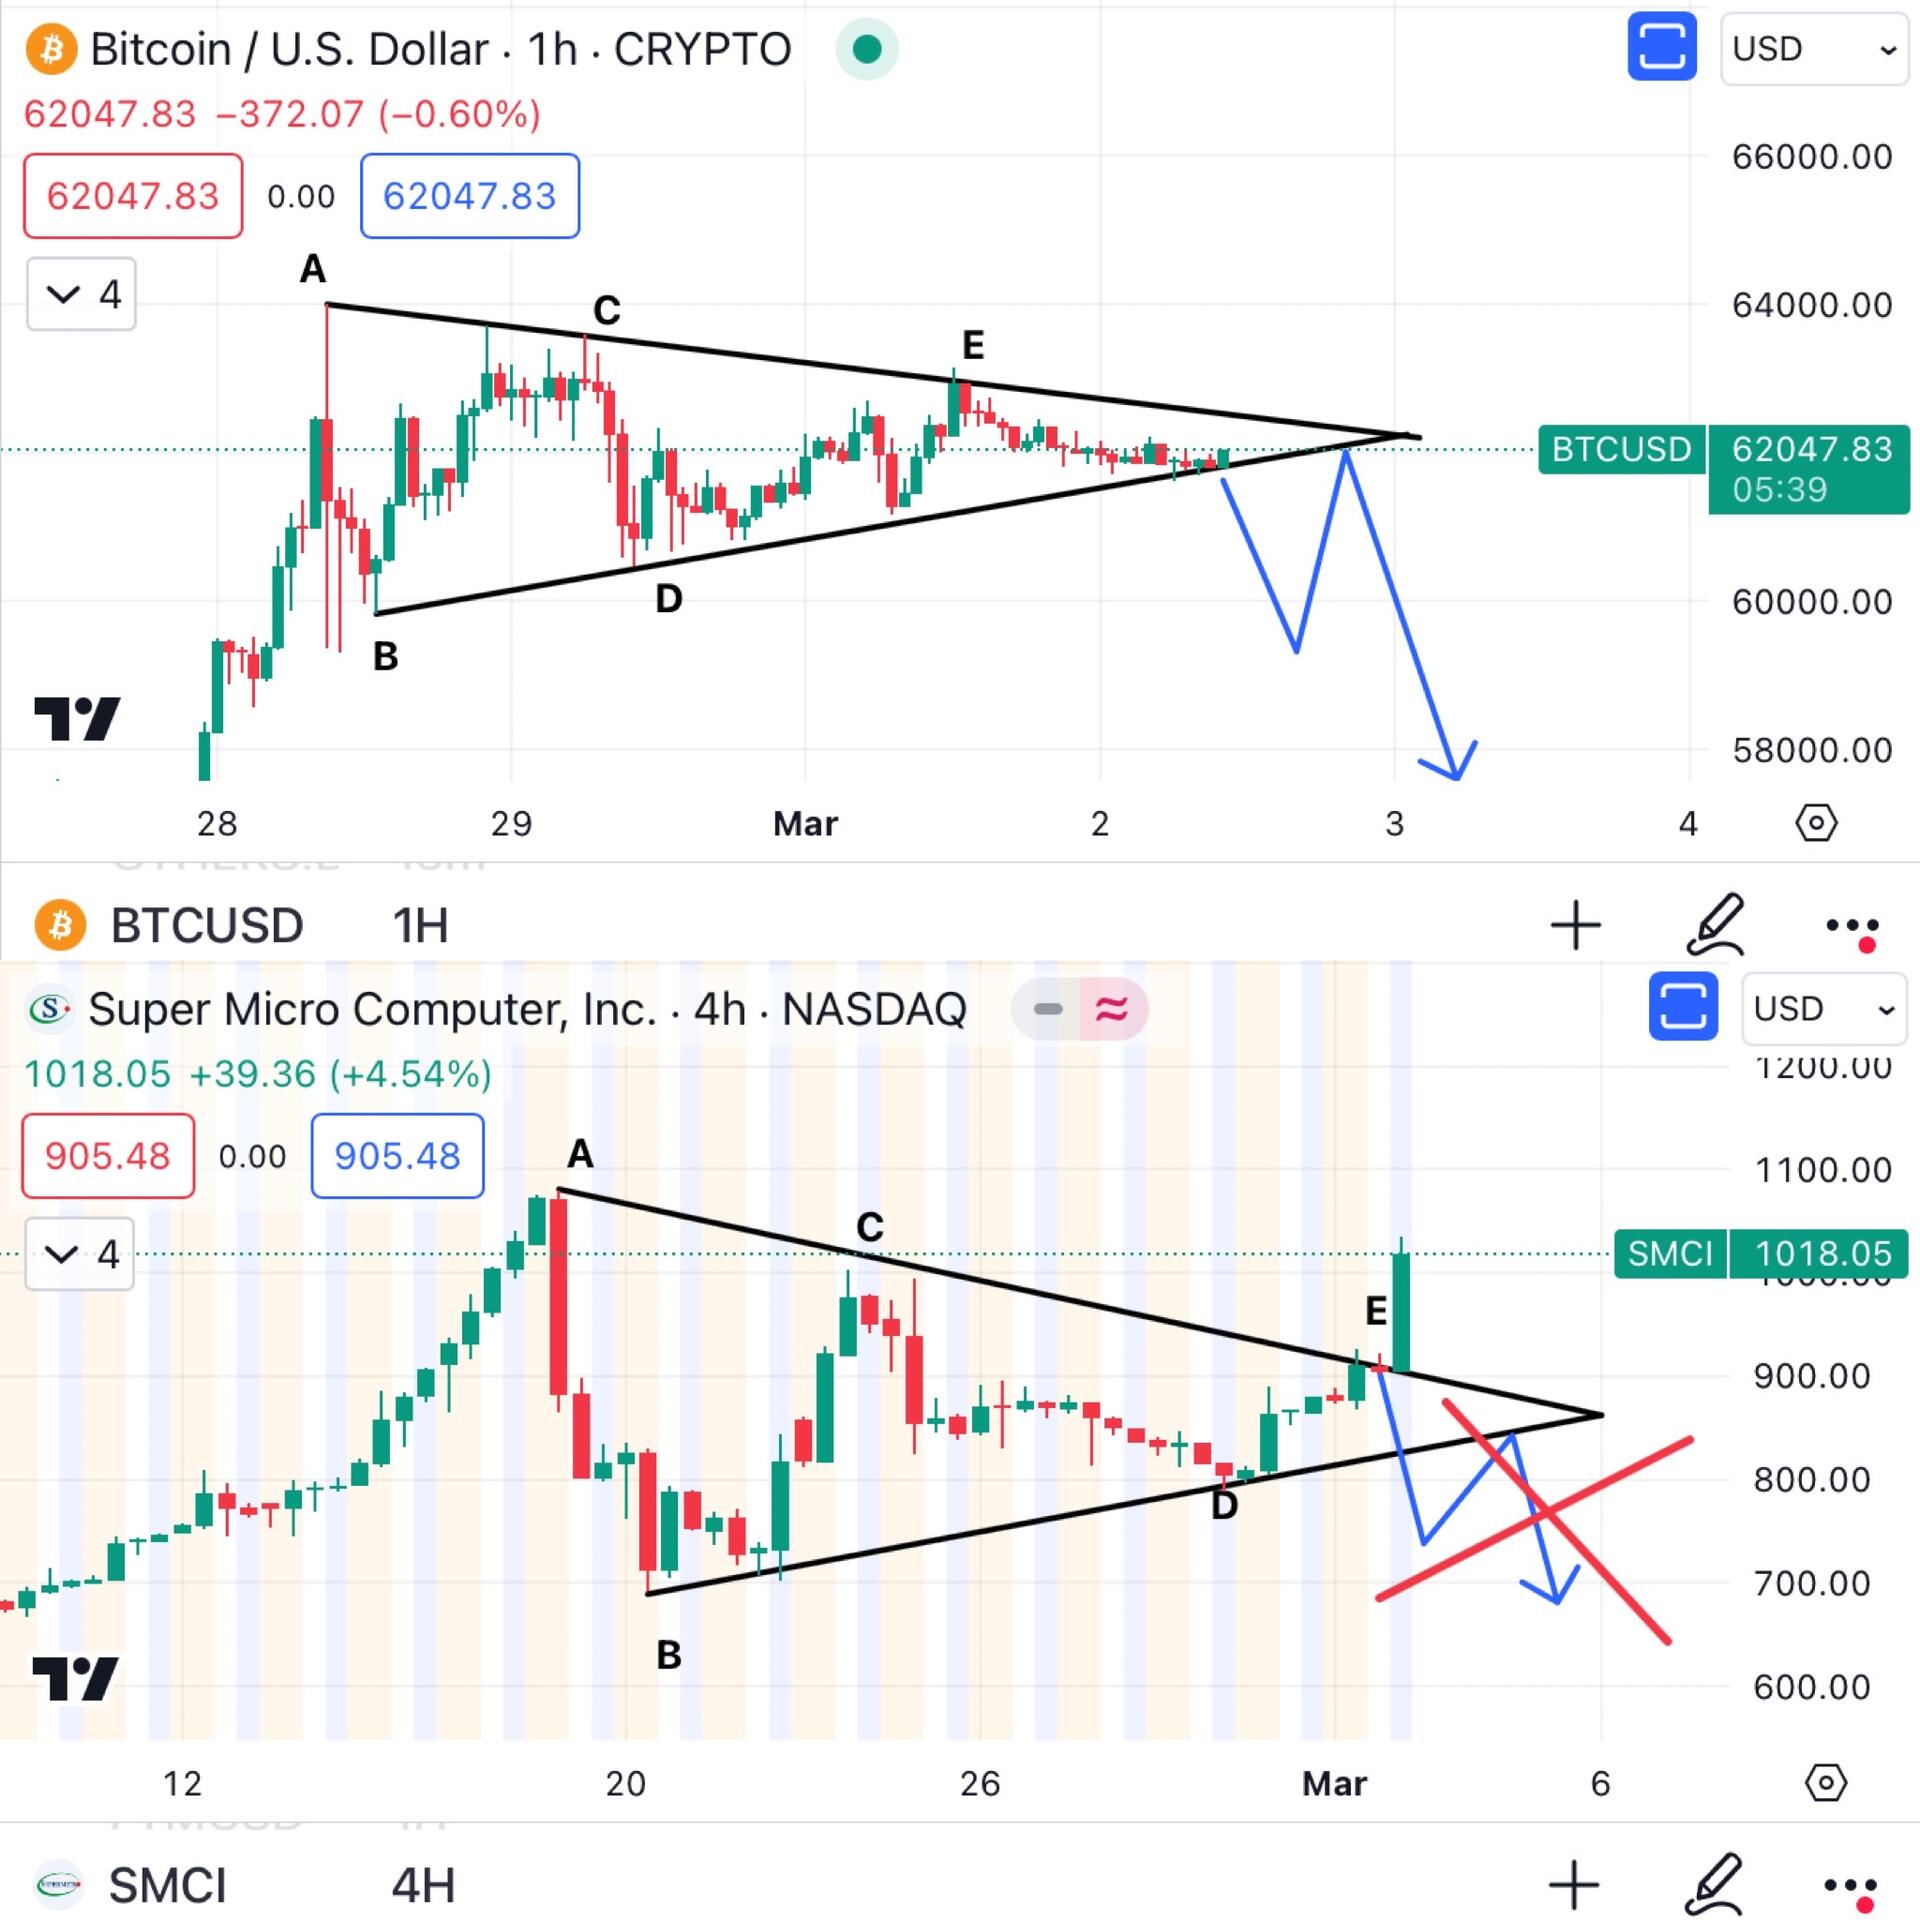
In previous cycles, whenever #Bitcoin reached at or near its ATH, $BTC experienced a 15-35% drawdown.
If this happened today, #BTC could drop to between $40k-$55k. Hopefully, these drawdowns are less volatile overtime. 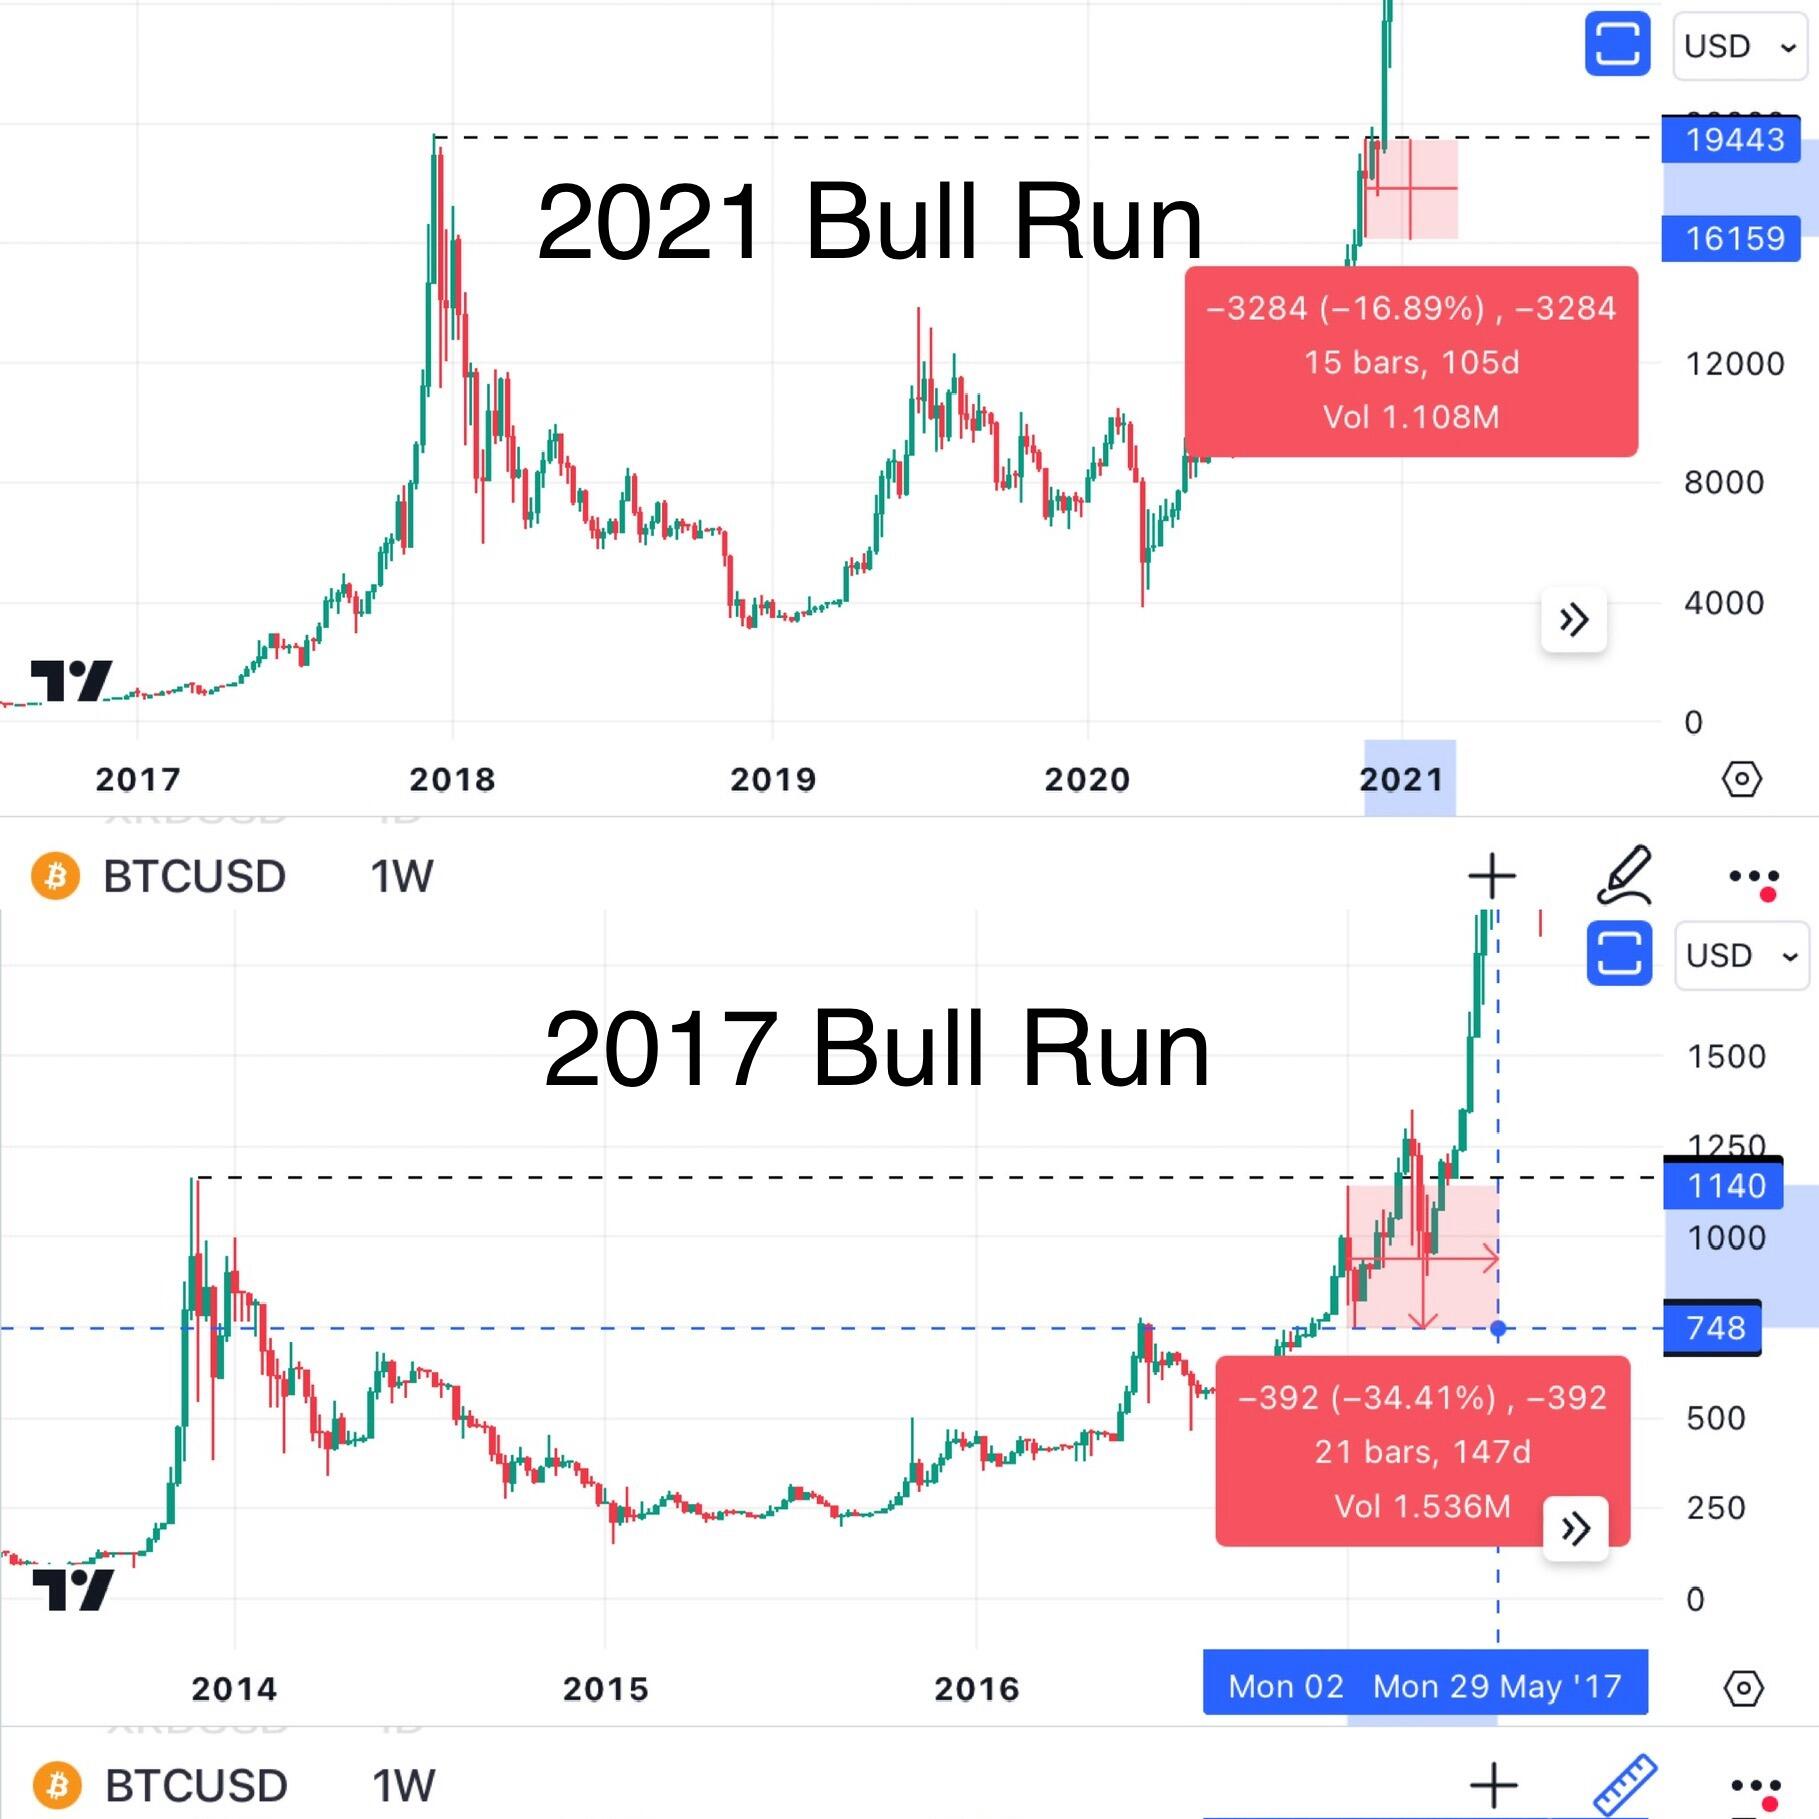
$BONK 2024 vs $DOGE 2021. Some things are different, and some things are the same.
Just like #DOGE did in 2021, I speculate that #BONK will break its ATH, and go higher… much higher. 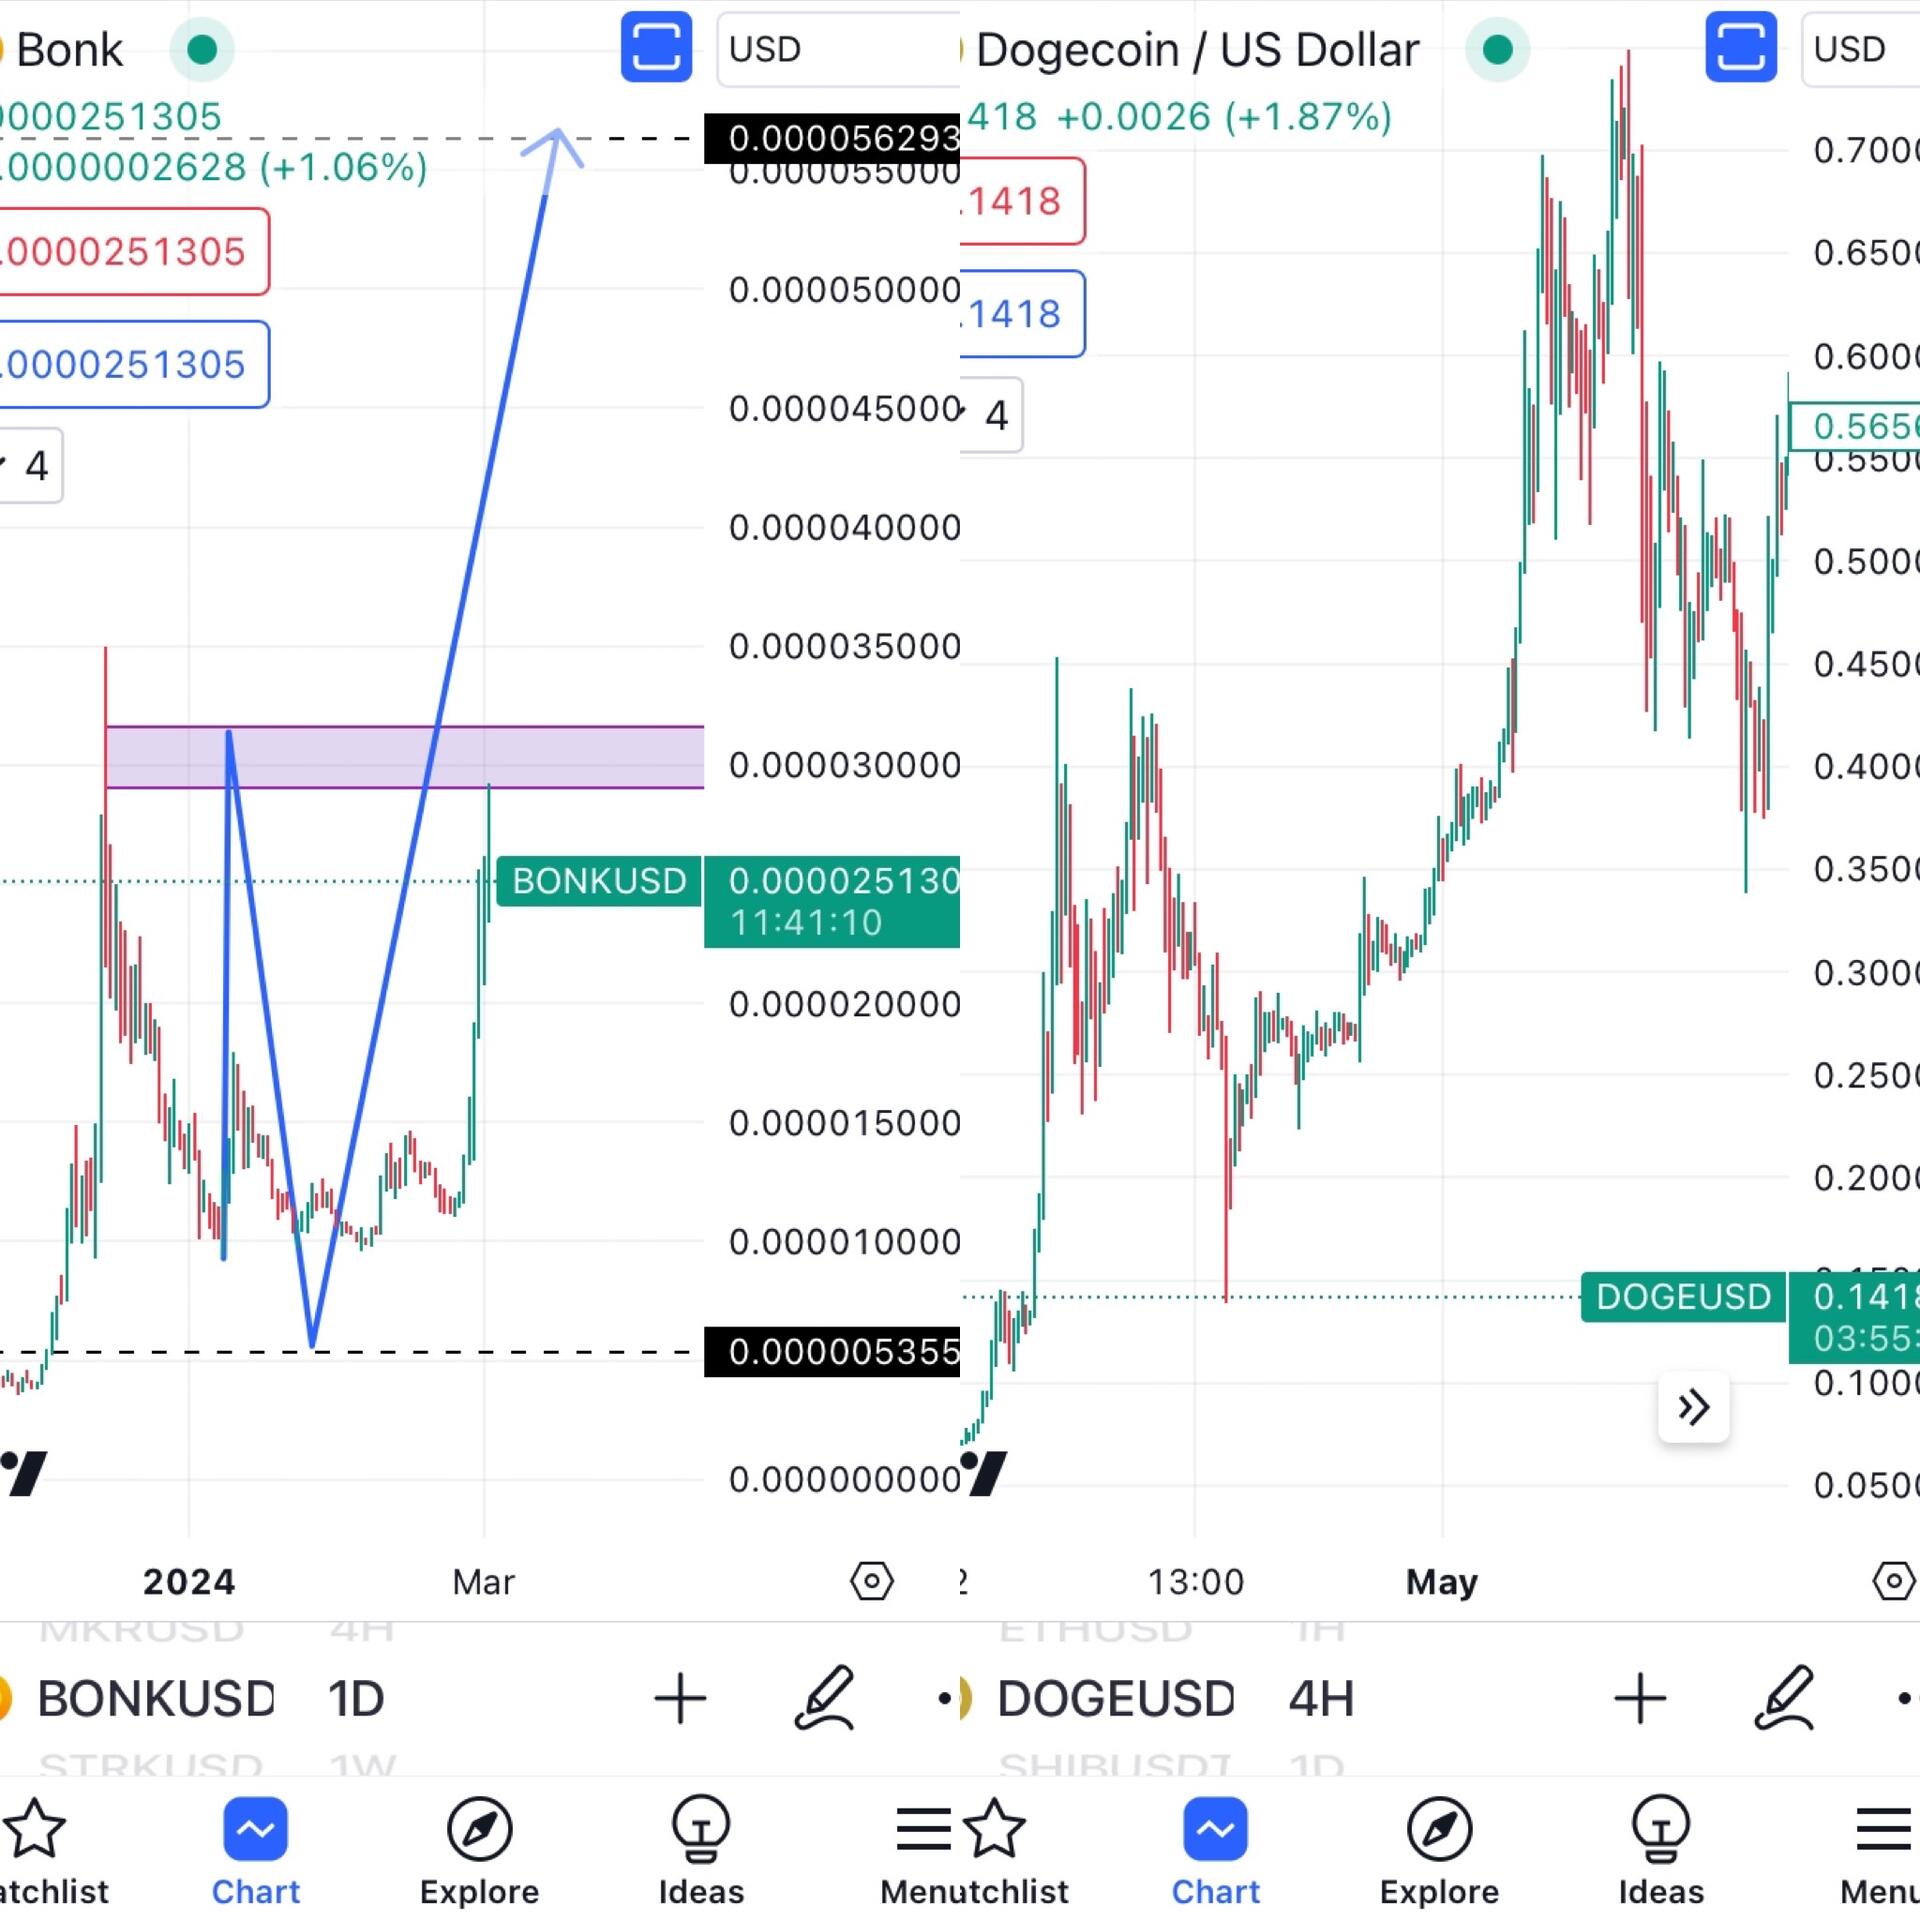
Dare I speculate? #Bitcoin #BTC $BTC #Elliottwave 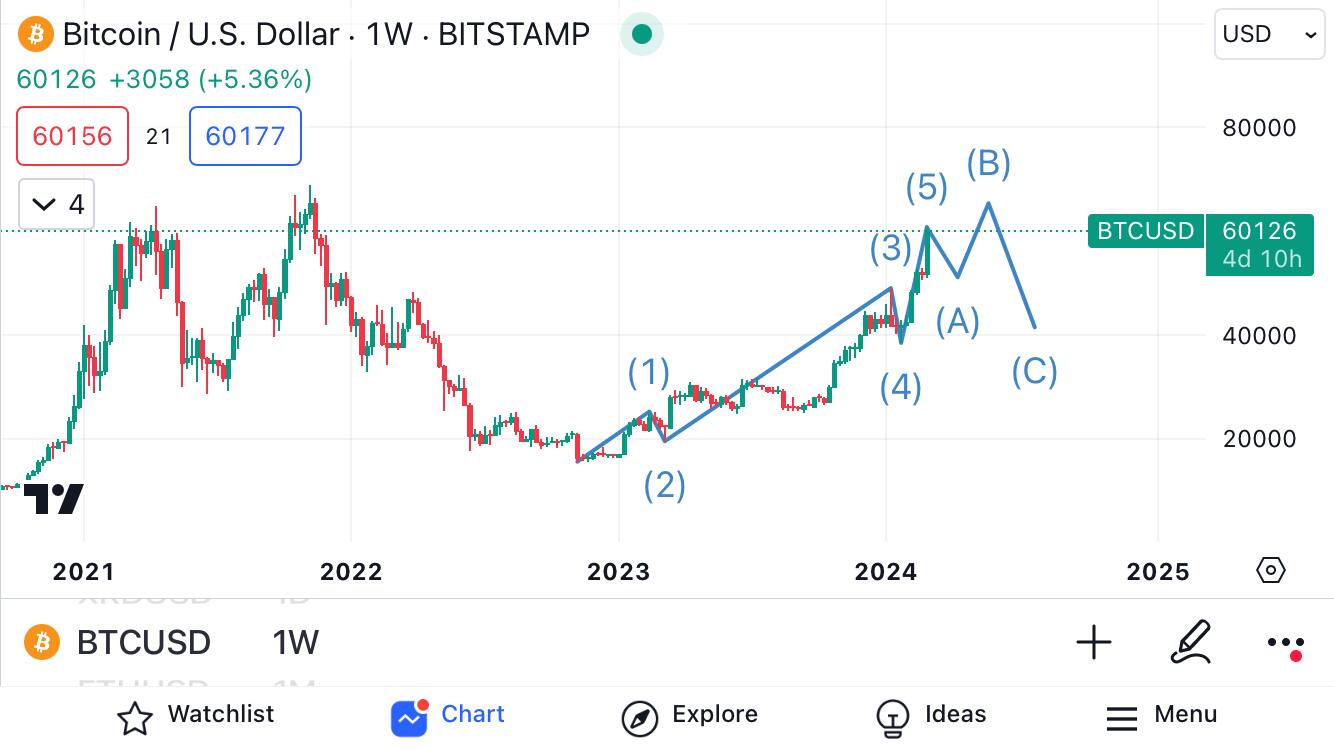
In my previous post, 2 weeks ago, I speculated $BTC will reach $60k, mitigating the last weekly FVG.
There are 2 scenarios now: (1) it would be healthy for #Bitcoin ’s price structure to retest previous support, so it can go higher in this cycle; or (2) go above the FVG, retest that, and go up from there. In the 2nd scenario, #BTC has a chance to lose steam more quickly IMO. 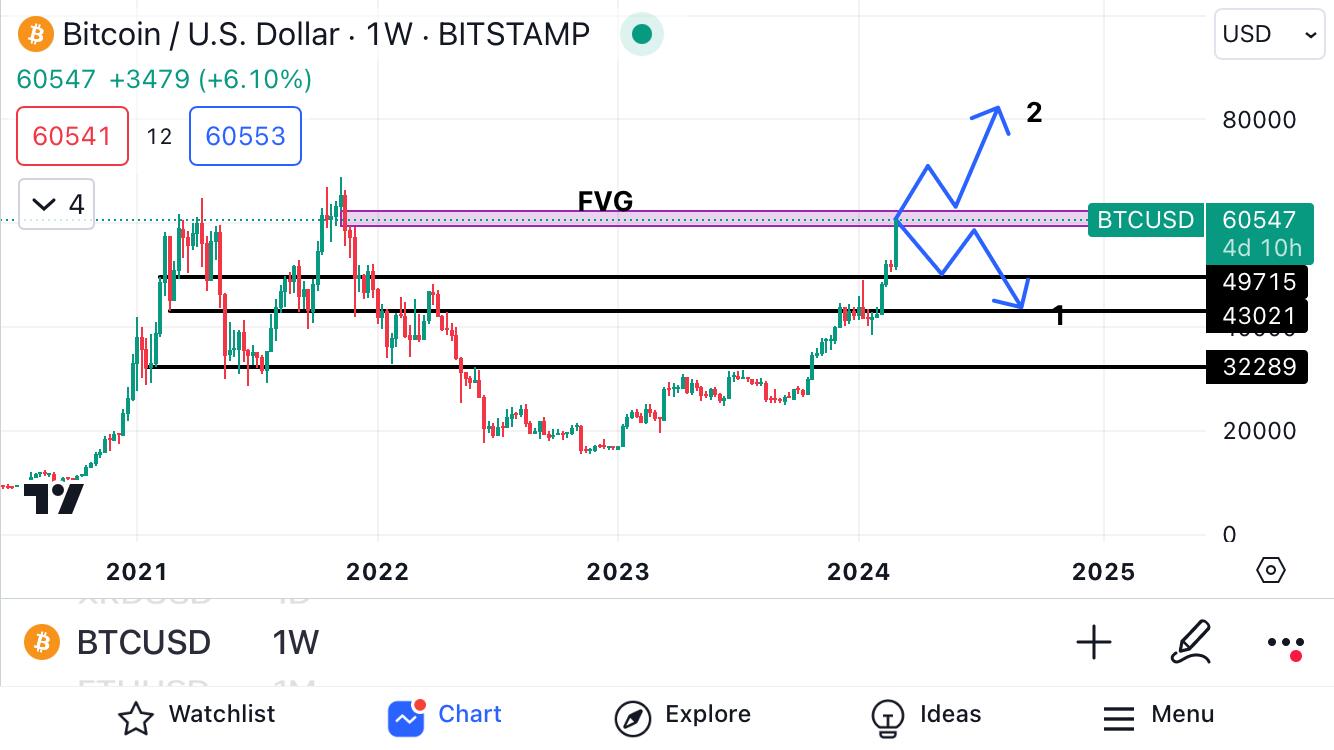
Nearly a week since $STRK started trading, #STRK has been rangebound.
Liquidity has been building below this range, and at some point (doesn’t have to be now), I speculate there’ll be a sweep of liquidity, before aiming to break out of resistance. #Starknet 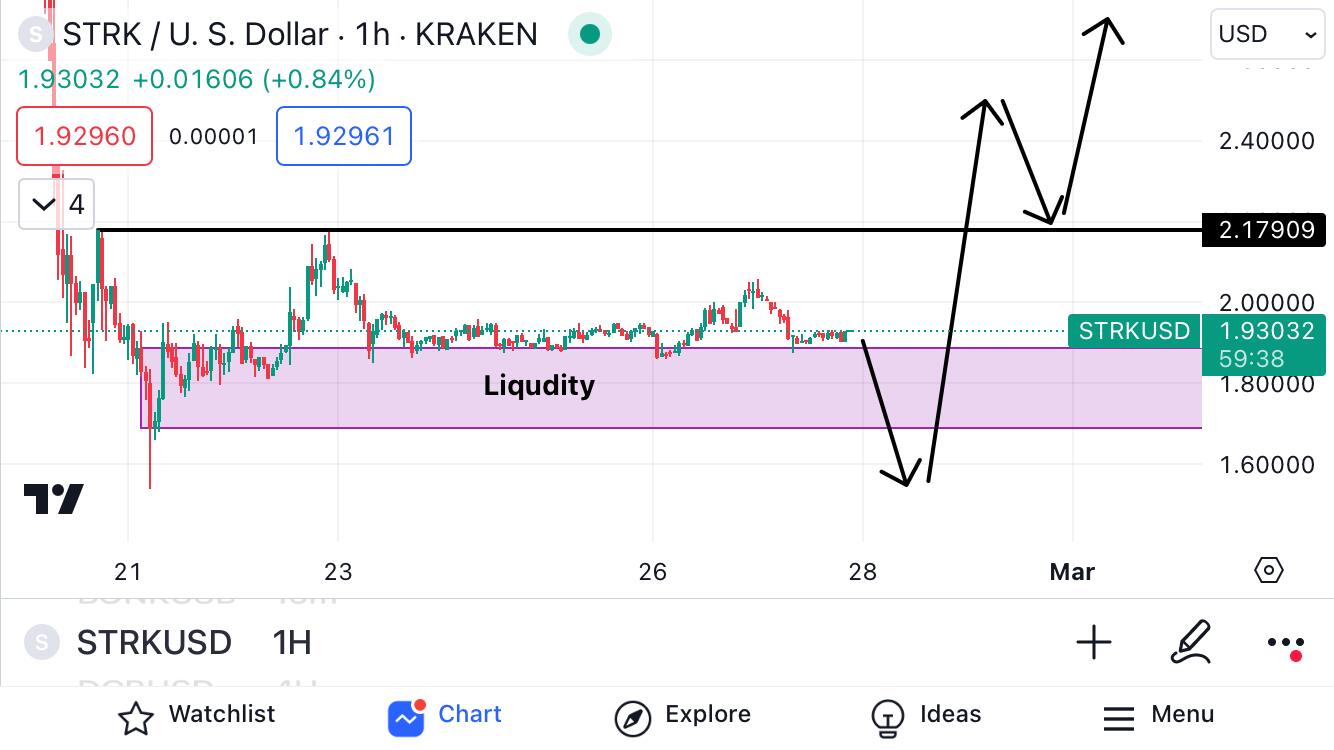
AOE notice that whenever $BTC moves 5%, $STX moves 20%?
#STX mitigated the last order block. I’m expecting a retest, and off to Valhalla. #Stacks #Blockstacks #Bitcoin #BTC 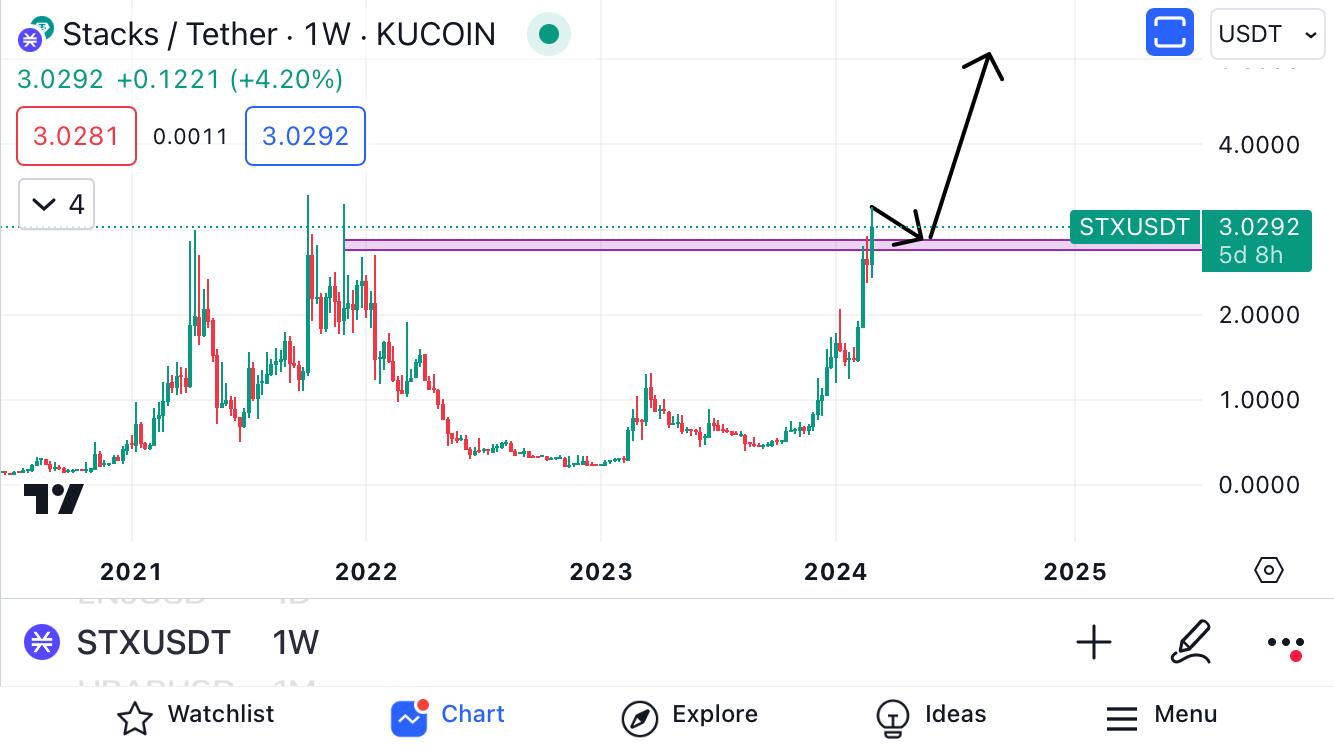
#DBG 2024 vs #BTC 2023. We’ve seen this story play out before. #DigiByte #Bitcoin #Wycoff 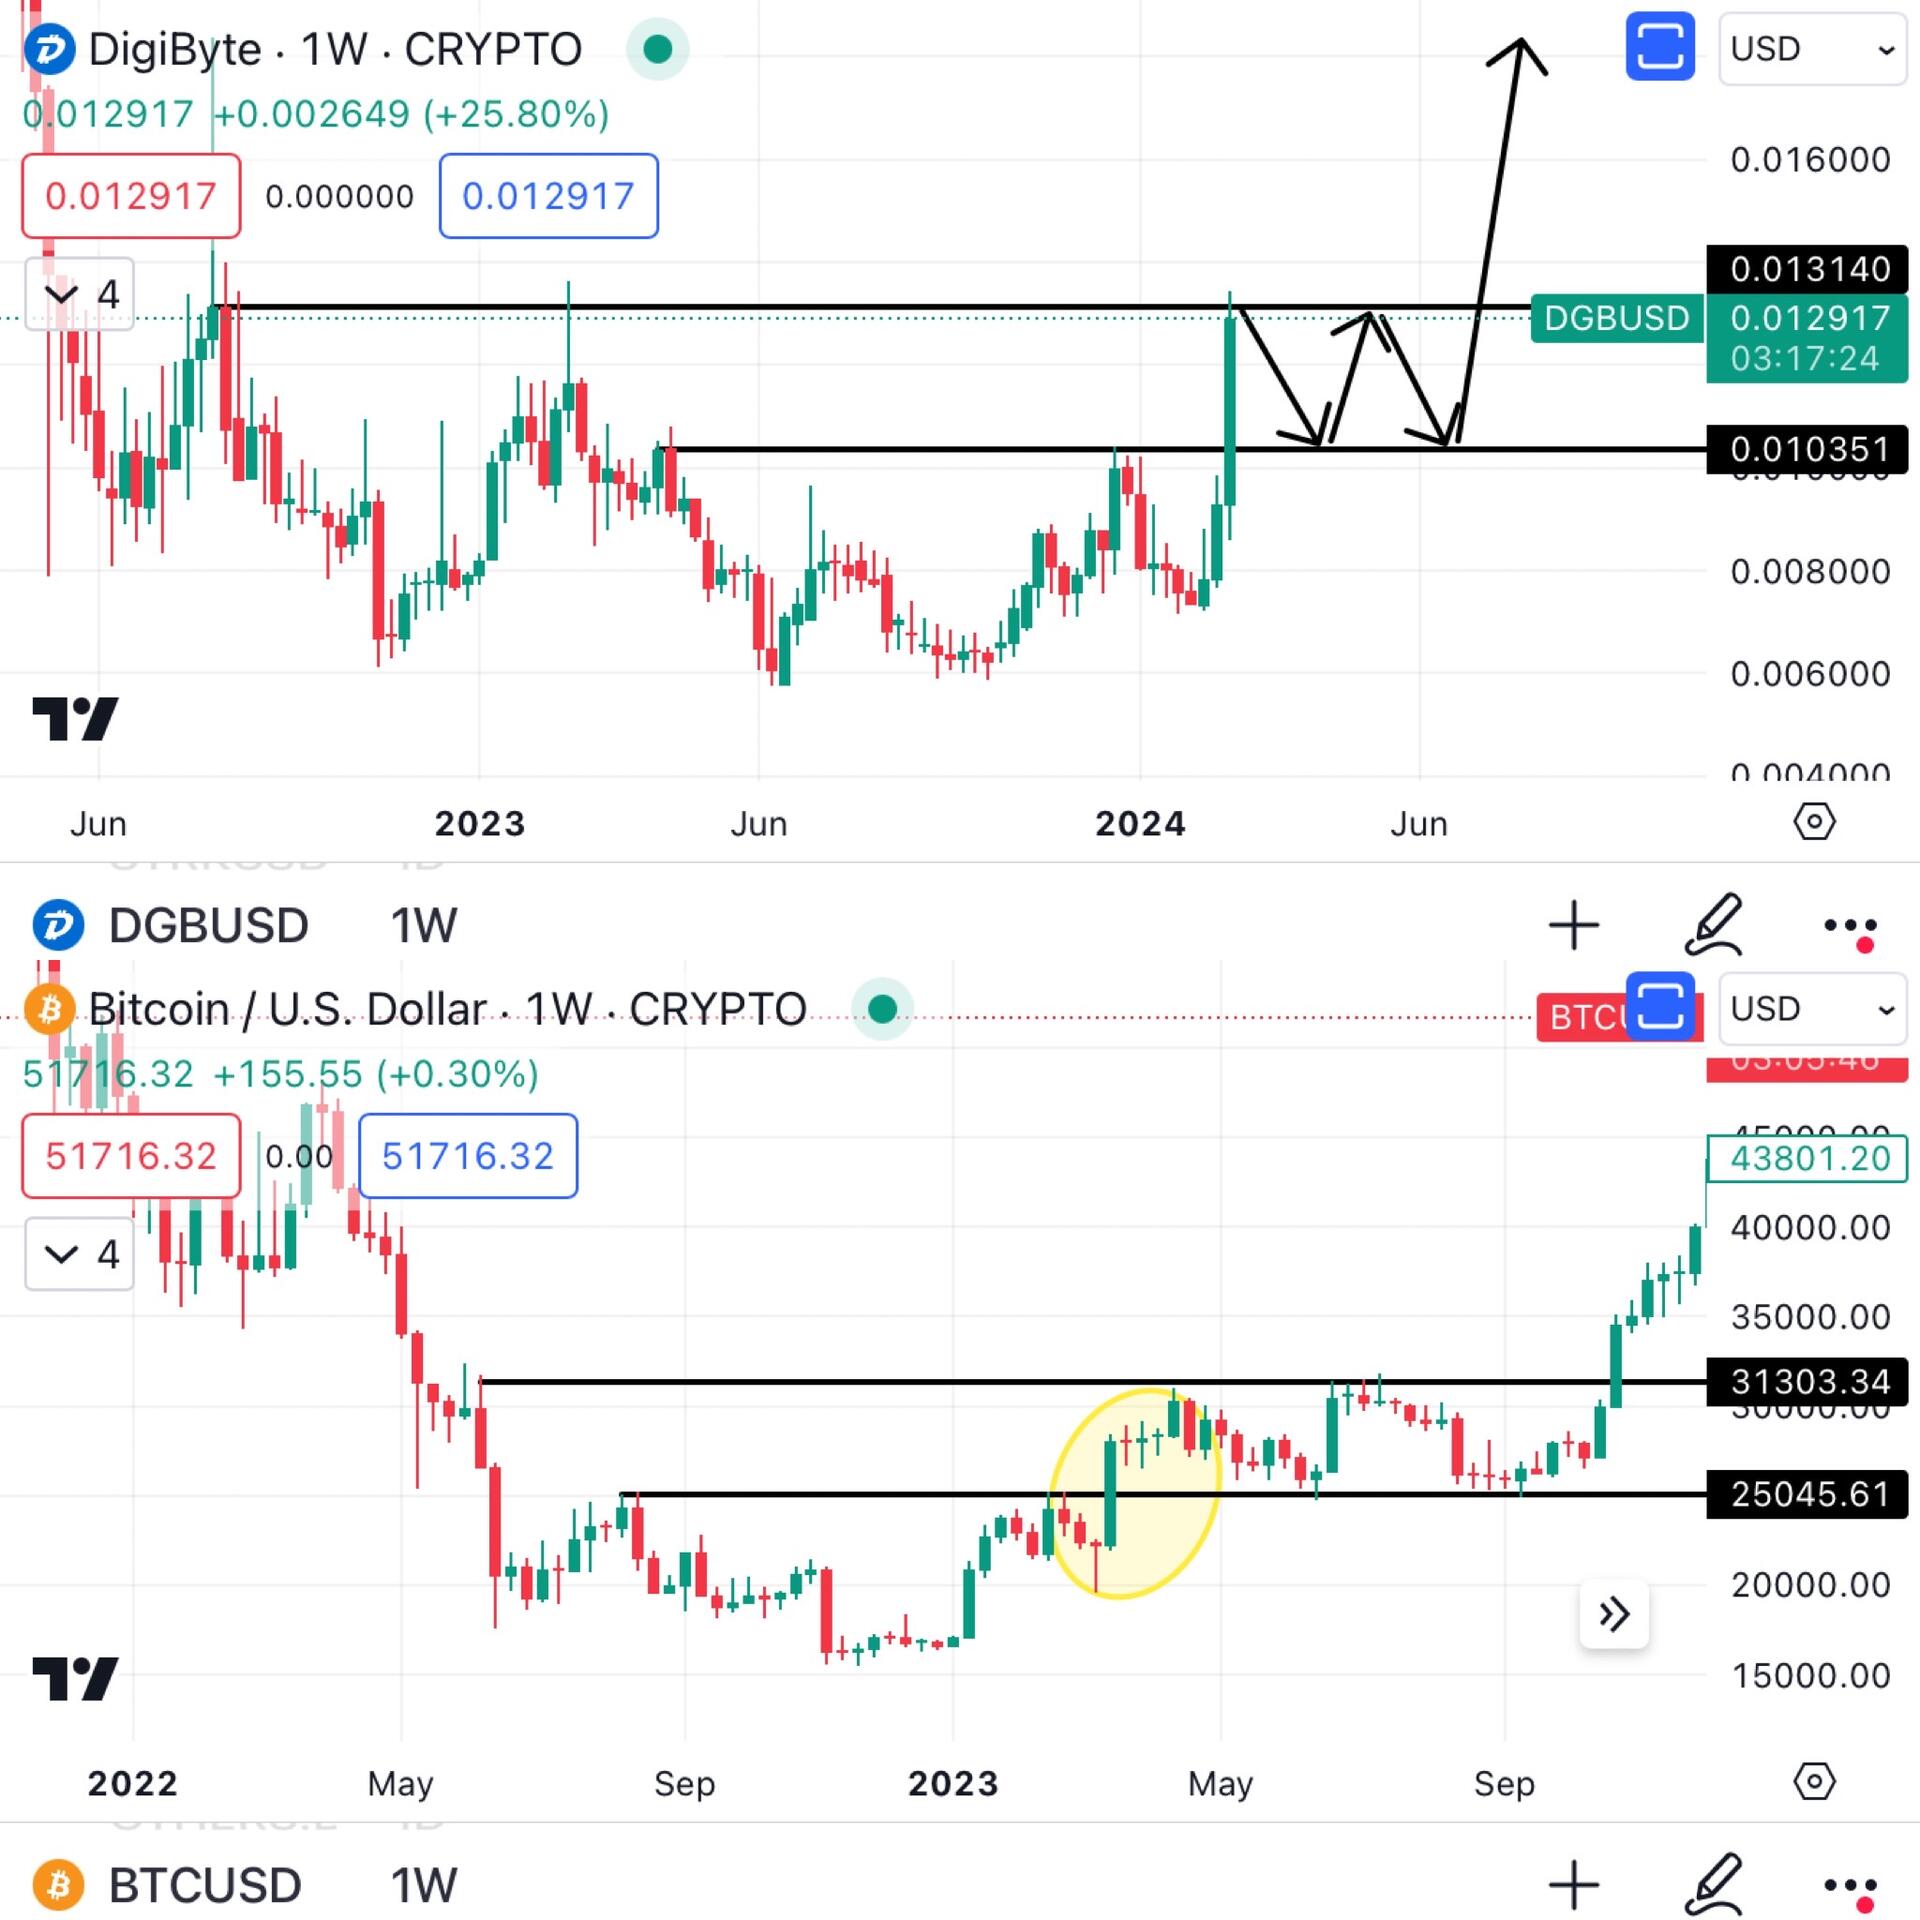
$DGB up 25%+ today with a sign of strength. However, it is hitting a resistance level.
I would expect #DGB to retest previous highs, before resuming a bullish uptrend. #DigiByte 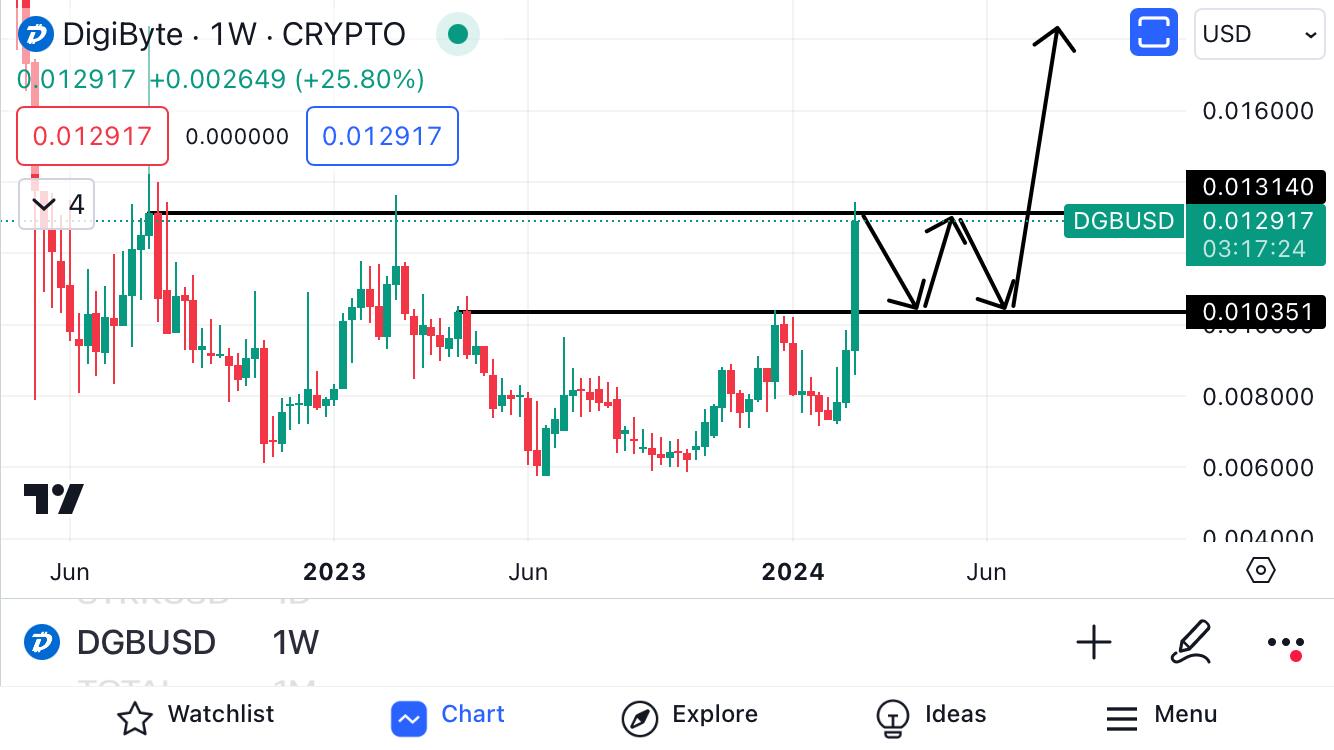
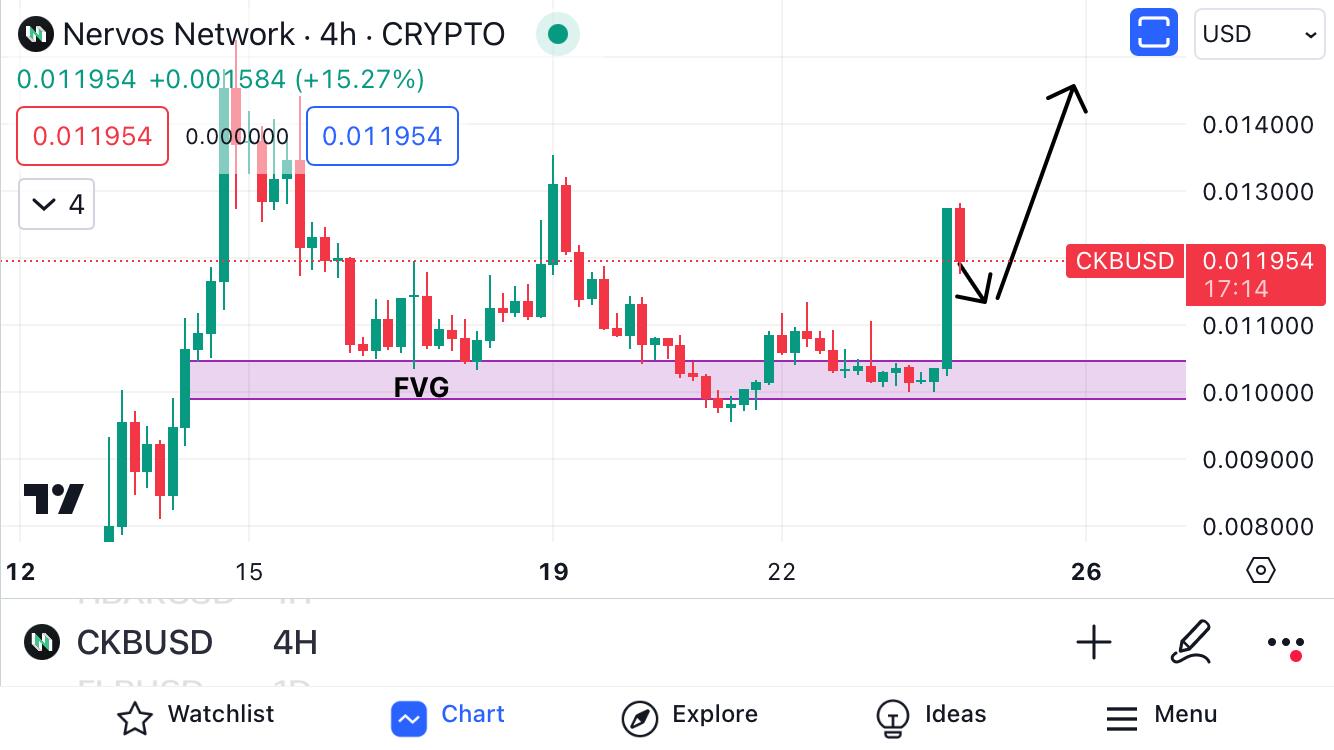
Even though it’s only been 10 days since $CKB made its local top, it feels as if it’s been weeks.
#CKB mitigated the FVG, finding its bottom there, and now has made a sign of strength. Good things are coming for the #NervosNetwork