
NFP #'s came in way too hot. 🔥
It will be difficult for the Fed to justify a slowdown in rate hikes if it continues its "data-dependent" stance.
Look at the reaction on the US 10 year yields.

Thanks for playing along.
$SPY $VIX

So you thought it was going to be up-only Uptober? Think again.
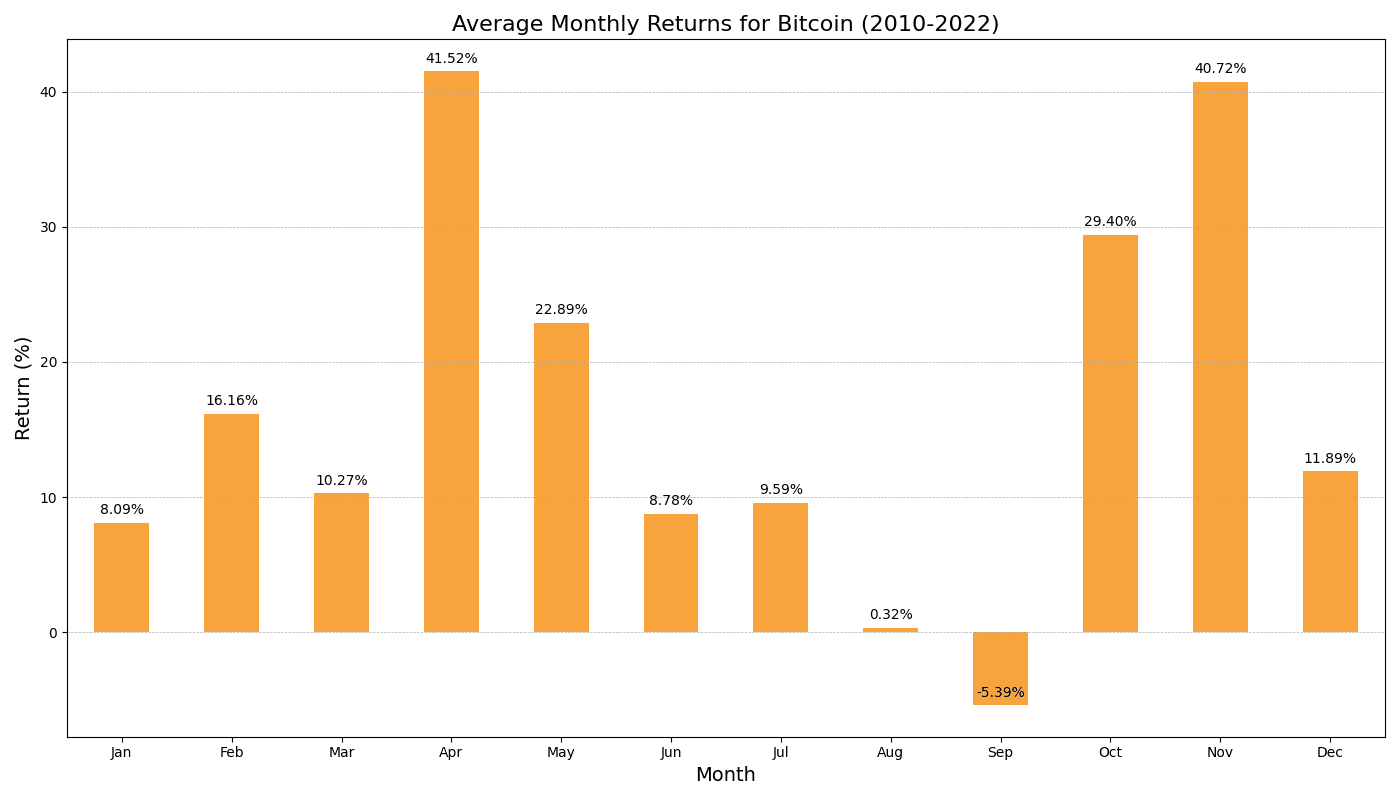
Looking back at the average weekly returns for $BTC since 2010, week 40 has traditionally been a weak week.
So if you subscribe to seasonality, this week should mark the local bottom.
If you're a more active trader, you can start looking for bottoming formations that, if they work, will provide good asymmetric upside.

#trading #Bitcoin
By now, most of you have probably seen a chart similar to this one, which shows that September is historically a seasonally weak month for $BTC.
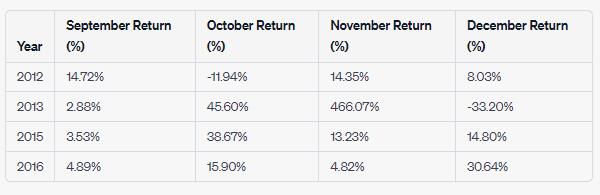
An interesting follow-up question is what does history have to say about months where September was actually positive?
Was the following month and the rest of the year positive?
Interestingly, since 2010, there have been 4 occasions where Sept. had positive returns.
After that, 3/4 had positive returns in October.
All 4/4 had positive returns in November and 3/4 had positive returns in December.
So on net, seasonally, it hasn't paid to be short #Bitcoin in Q4.
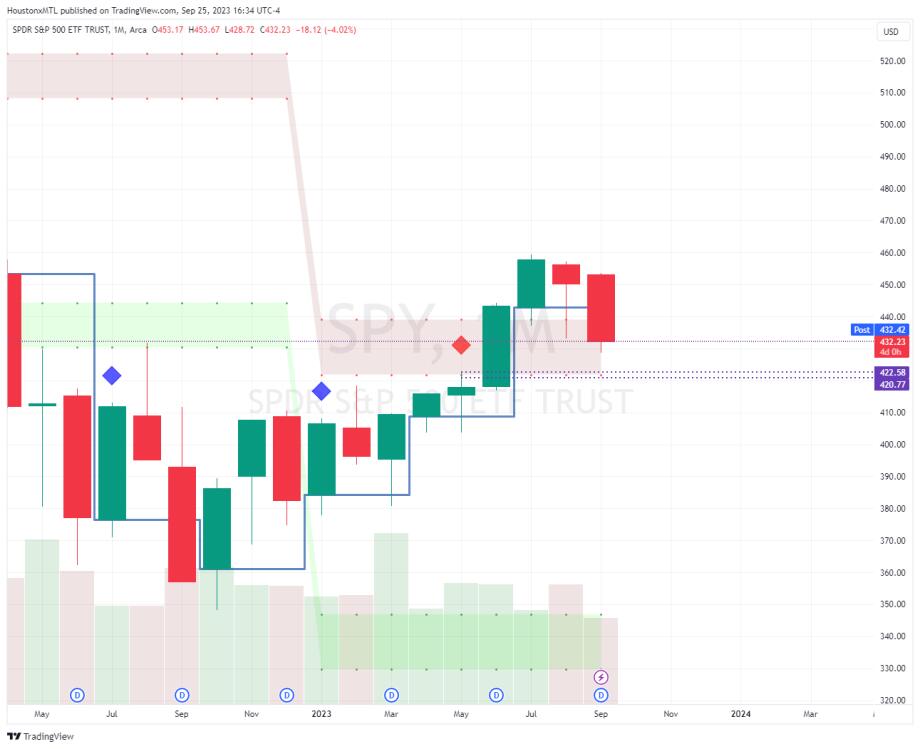
$BTC has some poor market structure in the 28970-29100 area from the previous selloff that is likely to be retested.
Any shorts still holding will have seen their profits evaporate and will likely throw in the towel at this point.

#BTC #trading
gm
Here's today's PSA.
Markets don't bottom on Fridays.
Reformed or let's say evolved stratter. 😁
Price action is one of the tools in the toolbox. 🛠️
We're in the midst of a min peak-to-trough 10%+ correction in equities. 📈📉
$VIX 19.55 is a forgone conclusion.
Watch and see if we get into the 21-22 area.
$SPY left a lot of poor market structure behind on it's run from 415-459.
$SPY 422 is high probability pivot followed by 420.
#trading
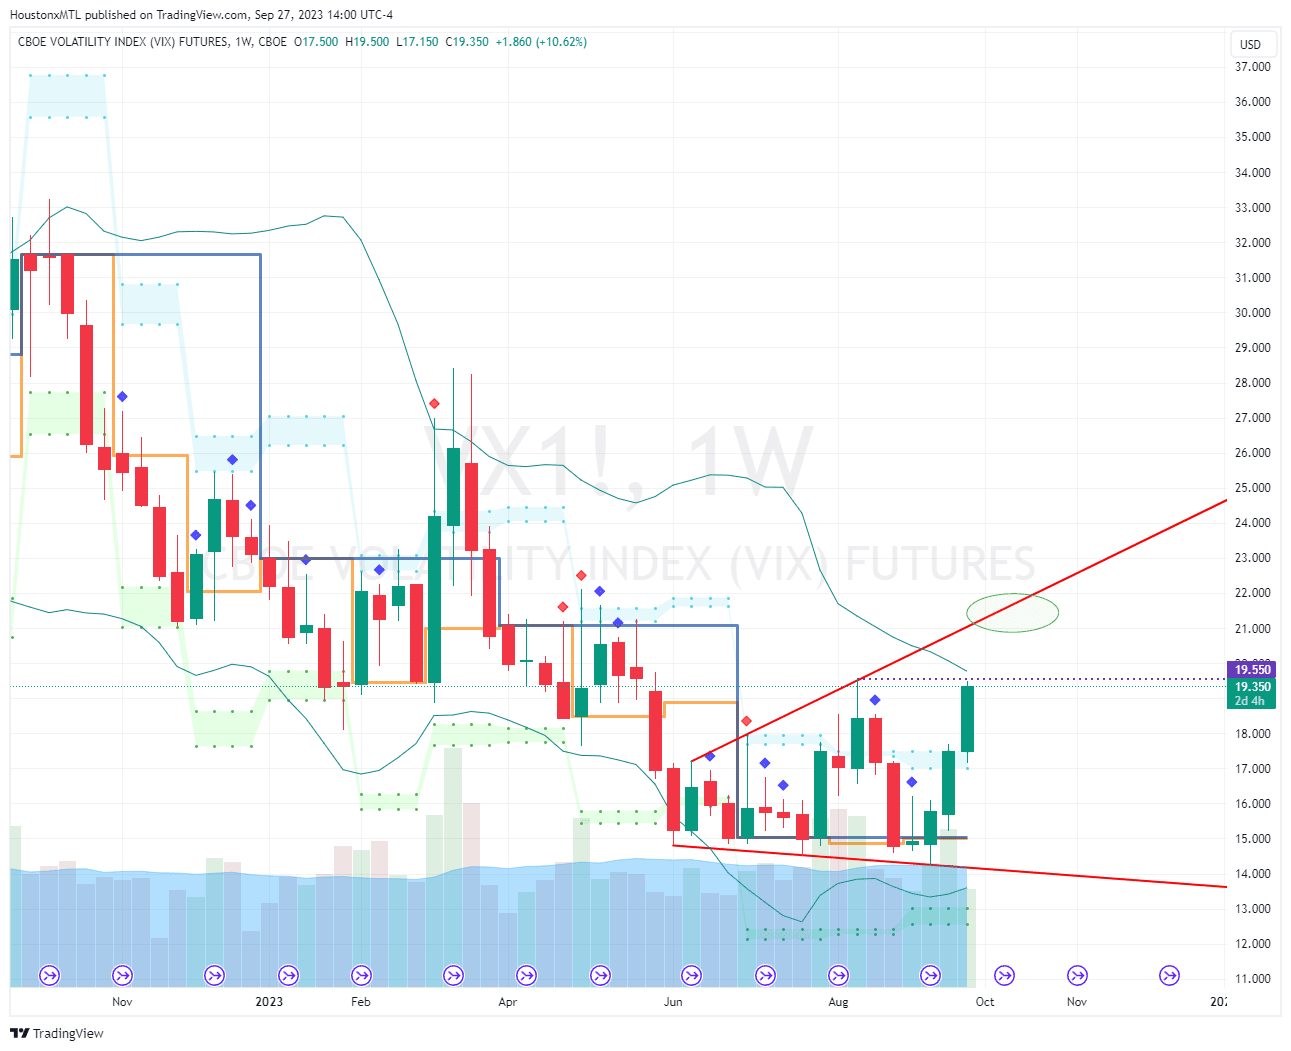
This is how I would draw the current BF playing out on $VIX.
There will be time to fade vol - just wait for some vol sellers to be put on stretchers first.

lnbc10u1pj39c8npp5ue84rfxen2phskfctl2525gn228hcf8zru6z8t9yhfdwlk5dm3hsdq5g9kxy7fqd9h8vmmfvdjscqzzsxqyz5vqsp5fj7tt6egjdaprzrcfrvqpkxk4hwrryw7g87wd8x4qjp7vppe3k3q9qyyssq9yda52qprpw0y382rs4wv65temegr0g3j2psftturz8q9nen86f9rly6z2fl5y5nam4ucyc7jus5lqn9l2sftrpmwsmg3egym2zlvvcpcnu625
gm
Here's today's PSA.
Risk off continues - $JNK and $HYG have both gone outside-inside month and down.


This has been on the radar for some time and is now confirmed.
Act accordingly.
https://primal.net/e/note1ecvx93ajhp6q0jewxaz6pg2c48sx4zxvnfyve0mjjs569pdvqpcq2kumsu

When it comes to studying price, it's important to recognize that price oscillates between periods of consolidation and expansion.
As it relates specifically to $VIX, it's good to understand that there is a huge cottage industry of traders who run a gamut of volatility selling strategies that are akin to picking up pennies in front of a train.
Most of the time these options sellers pick up those proverbial pennies, but there are those periods when volatility does not revert and these traders get run over.
In this situation, when I use the term range expansion, I am describing 2 scenarios.
1 - $VIX is now trading above and through its average monthly range (light blue line).
This does not occur often, but you can see on the chart that when $VIX closes above this monthly range, it tends to lead to further price expansion.
2 - Range expansion also describes a sequence of price action involving broadening formations (shown in red) where price moves from one side of the range to the other. TLDR - The markets are an auction mechanism that seeks liquidity aka stops, which is why we often experience periods of higher highs and lower lows.
Hold on to your top hats, things are about to get bumpy.
$VIX range expansion underway.

Watch out - USDJPY heading for multi-year highs.
Remember that of all the G10 nations, Japan is furthest along the path of monetary experimentation.
Daily - 
3 x outside-inside and break to the upside.
The triple outside bar is noteworthy as we can now certainly expect a range extension.
Weekly -
The weekly chart shows a continuation of the momo up condition. We will see how long this condition will last.
Putting this out there as a possibility - but a re-test of the 200 pivot is a long term possibility and would likely be the result of a very large macro event.

GM
Repeat after me - "Markets don't bottom on Fridays".
$JNK $HYG update
You need to be paying attention to $JNK and $HYG to understand how the markets are pricing risk.
They are both closing in on going outside month and down. 🔻


There are still 8 days remaining in the month and quarter. Will we trigger before the end of the month and quarter? Keep watching carefully. 👀
https://iris.to/note1xtmcxqs0h0psjccnxfak9ecl2pl57p9tya2875qrnjqk7s6c5stsgz4jnc
$TLT - long bond update.
$TLT broke below last year's lows.
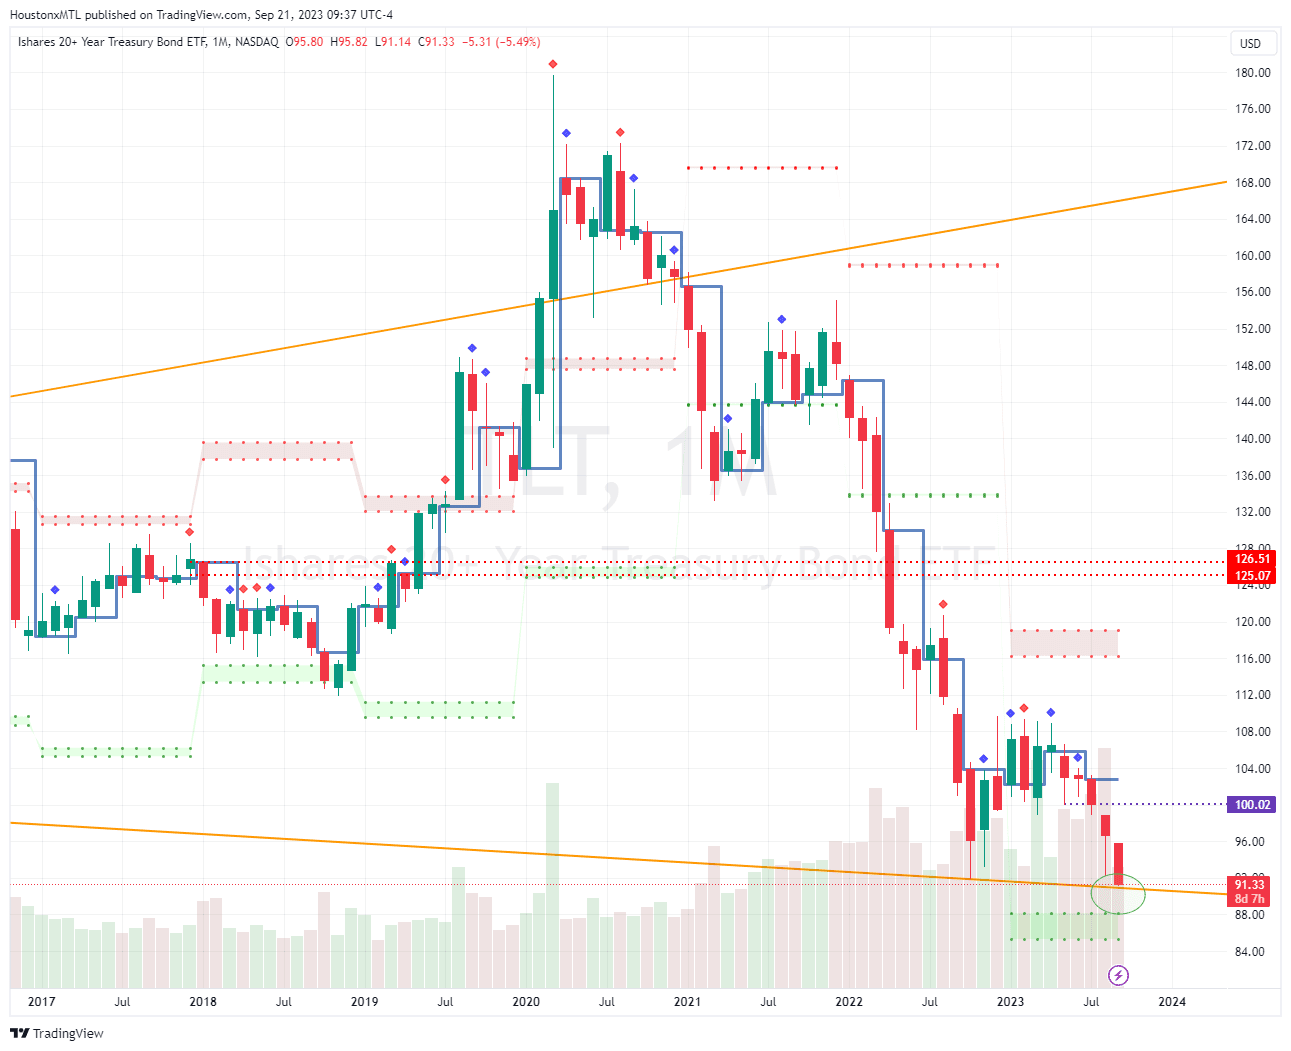
Wild to see $TLT retrace all the way back to 2006 levels.

______
I posted the following over a month ago:
https://iris.to/note1pn500p47g69779zzd8pg6uk64hn70s2dnlhtzmnwg88dkj9ur27stafx5a
Breakout.
The US 2 year yield is trading at 5.12.
Highest levels since 2006.
